EP2146259B1 - Method and apparatus to create process control graphics based on process control algorithm information - Google Patents
Method and apparatus to create process control graphics based on process control algorithm information Download PDFInfo
- Publication number
- EP2146259B1 EP2146259B1 EP09155953.4A EP09155953A EP2146259B1 EP 2146259 B1 EP2146259 B1 EP 2146259B1 EP 09155953 A EP09155953 A EP 09155953A EP 2146259 B1 EP2146259 B1 EP 2146259B1
- Authority
- EP
- European Patent Office
- Prior art keywords
- process control
- graphic
- image
- control algorithm
- algorithm information
- Prior art date
- Legal status (The legal status is an assumption and is not a legal conclusion. Google has not performed a legal analysis and makes no representation as to the accuracy of the status listed.)
- Active
Links
- 238000004886 process control Methods 0.000 title claims description 579
- 238000000034 method Methods 0.000 title claims description 211
- 230000008859 change Effects 0.000 claims description 4
- 238000001914 filtration Methods 0.000 claims 1
- 238000003780 insertion Methods 0.000 claims 1
- 230000037431 insertion Effects 0.000 claims 1
- 230000006870 function Effects 0.000 description 245
- 230000008569 process Effects 0.000 description 139
- 238000012545 processing Methods 0.000 description 37
- 239000012530 fluid Substances 0.000 description 33
- 238000012905 input function Methods 0.000 description 30
- 230000000007 visual effect Effects 0.000 description 16
- 238000004891 communication Methods 0.000 description 15
- 238000010586 diagram Methods 0.000 description 10
- 238000013461 design Methods 0.000 description 9
- 101000609957 Homo sapiens PTB-containing, cubilin and LRP1-interacting protein Proteins 0.000 description 7
- 102100039157 PTB-containing, cubilin and LRP1-interacting protein Human genes 0.000 description 7
- 238000007667 floating Methods 0.000 description 7
- 238000005259 measurement Methods 0.000 description 7
- 239000000126 substance Substances 0.000 description 7
- 230000009471 action Effects 0.000 description 5
- 238000004519 manufacturing process Methods 0.000 description 5
- 238000011161 development Methods 0.000 description 4
- 230000002093 peripheral effect Effects 0.000 description 4
- 230000000694 effects Effects 0.000 description 3
- 238000004364 calculation method Methods 0.000 description 2
- 239000000470 constituent Substances 0.000 description 2
- 238000005516 engineering process Methods 0.000 description 2
- 238000012423 maintenance Methods 0.000 description 2
- 238000012544 monitoring process Methods 0.000 description 2
- 239000004065 semiconductor Substances 0.000 description 2
- 230000003068 static effect Effects 0.000 description 2
- 238000012800 visualization Methods 0.000 description 2
- 230000001413 cellular effect Effects 0.000 description 1
- 239000002131 composite material Substances 0.000 description 1
- 238000011217 control strategy Methods 0.000 description 1
- 230000008878 coupling Effects 0.000 description 1
- 238000010168 coupling process Methods 0.000 description 1
- 238000005859 coupling reaction Methods 0.000 description 1
- 239000012634 fragment Substances 0.000 description 1
- 230000003287 optical effect Effects 0.000 description 1
- 239000003208 petroleum Substances 0.000 description 1
- 239000000344 soap Substances 0.000 description 1
- 238000012360 testing method Methods 0.000 description 1
- 238000012546 transfer Methods 0.000 description 1
Images


Classifications
-
- G—PHYSICS
- G05—CONTROLLING; REGULATING
- G05B—CONTROL OR REGULATING SYSTEMS IN GENERAL; FUNCTIONAL ELEMENTS OF SUCH SYSTEMS; MONITORING OR TESTING ARRANGEMENTS FOR SUCH SYSTEMS OR ELEMENTS
- G05B19/00—Programme-control systems
- G05B19/02—Programme-control systems electric
- G05B19/04—Programme control other than numerical control, i.e. in sequence controllers or logic controllers
- G05B19/042—Programme control other than numerical control, i.e. in sequence controllers or logic controllers using digital processors
- G05B19/0426—Programming the control sequence
-
- G—PHYSICS
- G05—CONTROLLING; REGULATING
- G05B—CONTROL OR REGULATING SYSTEMS IN GENERAL; FUNCTIONAL ELEMENTS OF SUCH SYSTEMS; MONITORING OR TESTING ARRANGEMENTS FOR SUCH SYSTEMS OR ELEMENTS
- G05B19/00—Programme-control systems
- G05B19/02—Programme-control systems electric
- G05B19/418—Total factory control, i.e. centrally controlling a plurality of machines, e.g. direct or distributed numerical control [DNC], flexible manufacturing systems [FMS], integrated manufacturing systems [IMS], computer integrated manufacturing [CIM]
-
- G—PHYSICS
- G05—CONTROLLING; REGULATING
- G05B—CONTROL OR REGULATING SYSTEMS IN GENERAL; FUNCTIONAL ELEMENTS OF SUCH SYSTEMS; MONITORING OR TESTING ARRANGEMENTS FOR SUCH SYSTEMS OR ELEMENTS
- G05B23/00—Testing or monitoring of control systems or parts thereof
- G05B23/02—Electric testing or monitoring
- G05B23/0205—Electric testing or monitoring by means of a monitoring system capable of detecting and responding to faults
- G05B23/0259—Electric testing or monitoring by means of a monitoring system capable of detecting and responding to faults characterized by the response to fault detection
- G05B23/0267—Fault communication, e.g. human machine interface [HMI]
- G05B23/0272—Presentation of monitored results, e.g. selection of status reports to be displayed; Filtering information to the user
-
- G—PHYSICS
- G06—COMPUTING; CALCULATING OR COUNTING
- G06F—ELECTRIC DIGITAL DATA PROCESSING
- G06F9/00—Arrangements for program control, e.g. control units
- G06F9/06—Arrangements for program control, e.g. control units using stored programs, i.e. using an internal store of processing equipment to receive or retain programs
- G06F9/44—Arrangements for executing specific programs
-
- G—PHYSICS
- G05—CONTROLLING; REGULATING
- G05B—CONTROL OR REGULATING SYSTEMS IN GENERAL; FUNCTIONAL ELEMENTS OF SUCH SYSTEMS; MONITORING OR TESTING ARRANGEMENTS FOR SUCH SYSTEMS OR ELEMENTS
- G05B2219/00—Program-control systems
- G05B2219/20—Pc systems
- G05B2219/23—Pc programming
- G05B2219/23258—GUI graphical user interface, icon, function bloc editor, labview
-
- G—PHYSICS
- G05—CONTROLLING; REGULATING
- G05B—CONTROL OR REGULATING SYSTEMS IN GENERAL; FUNCTIONAL ELEMENTS OF SUCH SYSTEMS; MONITORING OR TESTING ARRANGEMENTS FOR SUCH SYSTEMS OR ELEMENTS
- G05B2219/00—Program-control systems
- G05B2219/20—Pc systems
- G05B2219/23—Pc programming
- G05B2219/23261—Use control template library
-
- G—PHYSICS
- G05—CONTROLLING; REGULATING
- G05B—CONTROL OR REGULATING SYSTEMS IN GENERAL; FUNCTIONAL ELEMENTS OF SUCH SYSTEMS; MONITORING OR TESTING ARRANGEMENTS FOR SUCH SYSTEMS OR ELEMENTS
- G05B2219/00—Program-control systems
- G05B2219/20—Pc systems
- G05B2219/23—Pc programming
- G05B2219/23274—Link graphical data for display automatically into program
-
- Y—GENERAL TAGGING OF NEW TECHNOLOGICAL DEVELOPMENTS; GENERAL TAGGING OF CROSS-SECTIONAL TECHNOLOGIES SPANNING OVER SEVERAL SECTIONS OF THE IPC; TECHNICAL SUBJECTS COVERED BY FORMER USPC CROSS-REFERENCE ART COLLECTIONS [XRACs] AND DIGESTS
- Y10—TECHNICAL SUBJECTS COVERED BY FORMER USPC
- Y10S—TECHNICAL SUBJECTS COVERED BY FORMER USPC CROSS-REFERENCE ART COLLECTIONS [XRACs] AND DIGESTS
- Y10S715/00—Data processing: presentation processing of document, operator interface processing, and screen saver display processing
- Y10S715/961—Operator interface with visual structure or function dictated by intended use
- Y10S715/965—Operator interface with visual structure or function dictated by intended use for process control and configuration
Landscapes
- Engineering & Computer Science (AREA)
- General Physics & Mathematics (AREA)
- Physics & Mathematics (AREA)
- Automation & Control Theory (AREA)
- Software Systems (AREA)
- General Engineering & Computer Science (AREA)
- Theoretical Computer Science (AREA)
- Quality & Reliability (AREA)
- Manufacturing & Machinery (AREA)
- Human Computer Interaction (AREA)
- Testing And Monitoring For Control Systems (AREA)
- User Interface Of Digital Computer (AREA)
- Stored Programmes (AREA)
Description
- The present disclosure relates generally to process control systems and, more particularly, to methods and apparatus to create process control graphics based on process control algorithm information.
- Process control systems, like those used in chemical, petroleum or other processes, typically include one or more process controllers and input/output (I/O) devices communicatively coupled to at least one host or operator workstation and to one or more field devices via analog, digital or combined analog/digital buses. The field devices, which may be, for example, valves, valve positioners, switches and transmitters (e.g., temperature, pressure and flow rate sensors), perform process control functions within the process such as opening or closing valves and measuring process control parameters. The process controllers receive signals indicative of process measurements made by the field devices and/or other information pertaining to the field devices, use this information to implement a control routine, and then generate control signals that are sent over the buses or other communication lines to the field devices to control the operation of the process. In this manner, the process controllers may execute and coordinate control strategies using the field devices via the buses and/or other communication links communicatively coupling the field devices.
- Information from the field devices and the controllers may be made available to one or more applications (i.e., software routines, programs, etc.) executed by the operator workstation (e.g., a processor-based system) to enable an operator to perform desired functions with respect to the process, such as viewing the current state of the process (e.g., via a graphical user interface), evaluating the process, modifying the operation of the process, etc. Many process control systems also include one or more application stations. Typically, these application stations are implemented using a personal computer, workstation, or the like that is communicatively coupled to the controllers, operator workstations, and other systems within the process control system via a local area network (LAN). Each application station may execute one or more software applications that perform campaign management functions, maintenance management functions, virtual control functions, diagnostic functions, real-time monitoring functions, safety-related functions, configuration functions, etc. within the process control system.
- Process control systems typically provide one or more operator terminals and/or application stations including one or more graphical interfaces to enable system operators to view current process-related algorithm information that may include functions and/or parameters, statistical and/or historical process information, alarm information, campaign management and/or execution information or, more generally, information provided by any or all of the applications associated with the process control system.
- System designers or engineers create process control graphics to display important process control information to system operators. This process control information may contain process control parameter information and/or process control functions. For example, a process control parameter may include a fluid flow rate associated with control process equipment (e.g., tanks, vats, mixers, boilers, evaporators, pumps, valves, etc.); while a process control function may contain information associated with portions of a process control system such as the tuning parameters in a control loop. System designers or engineers typically create process control graphics separately from the process control algorithm information. In particular, system designers or engineers often create the process graphic structure and then manually enter data sources (for numeric fields, bar graphs, tank levels, etc.) associated with process control functions and/or parameters. The system designer or engineer usually manually enters the data source by typing or browsing the data source path back to the process control algorithm information. This manual process tends to be slow and can result in incorrect path references. A given process graphic may contain hundreds of data paths, leading to a lengthy development time and an increased probability of creating an incorrect path reference.
-
US 2005/257204 is considered as relevant prior art and is directed to a system and method for designing animated visualization interfaces depicting, at a supervisory level, manufacturing and process control information wherein graphical symbols in the visualization interfaces are associated with components of a process control/manufacturing information application. The system includes a graphical symbol library for maintaining a set of graphical symbol templates wherein the graphical symbol templates including a graphics definition including graphics and a reference to an application component type. The reference facilitates identifying candidate application components for creating an association between a graphical symbol instance created from a graphical symbol template and one of the candidate application components. The system also includes a graphical symbol design environment for selecting the graphical symbol template, specifying an application component corresponding to the component type, and creating an association between the graphical symbol instance and the specified application component. -
US 6,854,111 discusses a library manager which holds related program fragments, for example, control logic fragments and visualization program fragments sharing the same control variables, in library files. Multiple copies of control logic program fragments are instantiated to develop a control program and of the control variable tags for each copy of the control logic program fragments are renamed to prevent conflicts. At a later time, visualization program fragments related to the control logic program fragments are identified by their common origin in the library manger. The control variables of these visual program fragments may then be automatically renamed by using their library files as a guide. The library files may also hold related non-program information. -
US 5,929,855 discloses a user interface for a control structure comprising a controller, and physical devices coupled to the controller. The controller is adapted to control and monitor the physical devices. The user interface is coupled to the controller for displaying representations of status conditions of the physical device. The user interface comprises a system database adapted to include the representation of the physical device, means for creating the system database within the user interface, a set of points to be used within the system database, the points being adapted to represent the physical devices and adapted to be accessible from the system database, and a set of pointgroups within the system database, adapted to represent multiparameter physical devices and adapted for accessibility from the system database, each pointgroup having at least one point linked to the pointgroup, and each point within a pointgroup representing one of the physical parameters of the physical device, the means for creating the system database including means for creating the representations, the creating means using the pointgroups to create the system database and the pointgroups allowing a user to decrease the amount of time spent on creating points for the physical devices. - A method of automatically linking process control graphics to process control algorithm information is described in
claim 1. A related system is discussed in claim 16. -
-
FIG. 1 is a block diagram illustrating an example process control system. -
FIG. 2 illustrates an example parameter definition user interface. -
FIG. 3 illustrates an examplegraphic representation 300 that includes a graphic and an example graphic property user interface. -
FIG.4 illustrates a block diagram of an example process control algorithm. -
FIG. 5 illustrates a block diagram of an example apparatus that may be used to automatically link process control algorithm information to process control graphics. -
FIG. 6 illustrates an example process control environment including a display containing a process control algorithm image and a process control graphic image. -
FIG. 7 illustrates the process control algorithm image ofFIG. 6 linked to the process control graphic image ofFIG. 6 . -
FIG. 8 illustrates a process control algorithm image, which is similar to the process control algorithm image ofFIG. 6 , but which contains a second function that includes four output parameters. -
FIG. 9 illustrates the process control algorithm image ofFIG. 8 and the process control graphic image ofFIG. 8 , which contains the two linked graphics. -
FIG. 10 illustrates the process control algorithm image ofFIG. 6 , the process control graphic image ofFIG. 6 , and a graphic property user interface. -
FIG. 11 illustrates the process control algorithm image ofFIG. 6 linked to the process control graphic image ofFIG. 6 . -
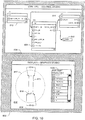
FIG. 12 illustrates the process control algorithm image ofFIG. 6 , and the process control graphic image ofFIG. 6 , which does not contain a graphic within the graphic image area. -
FIG. 13 illustrates the process control algorithm image ofFIG. 6 and the process control graphic image ofFIG. 6 , which contains a graphical user interface list. -
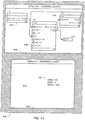
FIG. 14 illustrates a display containing the process control algorithm image ofFIG. 6 and the process control graphic image ofFIG. 6 , which includes the visual representation of the graphic ofFIG 13 . -
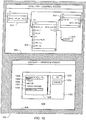
FIG. 15 illustrates the process control algorithm image ofFIG. 12 and the process control graphic image ofFIG. 12 , which contains the graphical user interface list ofFIG. 13 . -
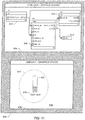
FIG. 16 illustrates a display containing the process control algorithm image ofFIG. 12 and the process control graphic image ofFIG. 12 , which contains visual graphical representations of a pump graphic and a valve graphic. -
FIG. 17 illustrates the process control algorithm image ofFIG. 12 and the process control graphic image ofFIG. 12 , which contains a graphical user interface list similar to the graphical user interface list ofFIG. 13 . -
FIG. 18 illustrates a display containing the process control algorithm image ofFIG. 12 and the process control graphic image ofFIG. 12 , which contains a visual graphical representation of the graphic. -
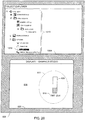
FIG. 19 illustrates a display containing a process control explorer image and the process control graphic image ofFIG. 6 . -
FIG. 20 illustrates the PUMP P321 with the process control explorer image ofFIG. 19 linked to the process control graphic image ofFIG. 6 . -
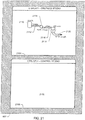
FIG. 21 illustrates a process control graphic image that contains graphics and a process control algorithm image, which does not contain a process control algorithm. -
FIG. 22 illustrates the process control graphic image ofFIG. 21 and the process control algorithm image ofFIG. 21 , which contains graphical user interface list. -
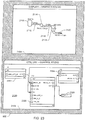
FIG. 23 illustrates a display containing the process control graphic image ofFIG. 21 and the process control algorithm image ofFIG. 21 , which contains a process control algorithm. -
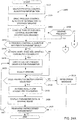
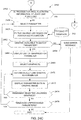
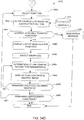
FIGS. 24A-24D are flow diagrams depicting an example method that may be used to automatically link process control algorithm information to process control graphics. -
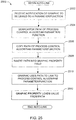
FIG. 25 is a flow diagram of an example method that may be used to automatically link a path between process control algorithm information and process control graphics. -
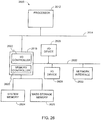
FIG. 26 is a block diagram of an example processor system that may be used to implement the example methods and apparatus described herein. - Although the following describes example methods and apparatus including, among other components, software and/or firmware executed on hardware, it should be noted that these examples are merely illustrative and should not be considered as limiting. For example, it is contemplated that any or all of the hardware, software, and firmware components could be embodied exclusively in hardware, exclusively in software, or in any combination of hardware and software. Accordingly, while the following describes example methods and apparatus, persons of ordinary skill in the art will readily appreciate that the examples provided are not the only way to implement such methods and apparatus.
- In general, the example apparatus, methods, and articles of manufacture described herein may be used within a process control system to provide a process graphics user interface environment for use by a variety of personnel associated with the configuration and/or operation of a process control system. More specifically, the example process graphics user interface described herein may be used to host one or more process control applications such as, for example, process monitoring applications, alarm management applications, process trending and/or history applications, batch processing and/or campaign management applications, streaming video applications, advanced control applications, etc. More generally, the example process graphics user interface described herein may be used to host applications associated with the development, deployment, configuration, design, customization, operation, maintenance, and/or support of a process control system. Personnel such as, for example, information technology personnel, configuration engineers, system operators, technical support engineers, software development engineers, test engineers, etc. may utilize various aspects of the example process graphics user interface described herein to perform their duties.
- A process graphic is a display representation for a parameter and/or function associated with process control algorithm information. A process graphic may include numeric fields, bar graphs, status tables and/or visual representations of tank fluid levels, pump speeds, fluid chemical concentrations, etc. Process graphics are typically used by system operators in a graphical interface to monitor control systems. The graphic elements within the interface may provide history and/or updated process information that operators may not otherwise have available. In addition, the graphic may enable system operators to change set point values and/or other parameters used by a process control algorithm. Process graphics may be implemented using a single shape graphic or a composite shape graphic. For example, some process graphics may be created by a user by enabling the user to select from different shapes and arranging the shapes to be representative of corresponding process equipment. Other process graphics may be predefined and packaged with process control software so that users can select from the predefined graphics. The process graphics may be interconnected by a user (e.g., an engineer, an operator, etc.) using a GUI-based design software application executed by a workstation.
- Process graphics contain properties that, in turn, may contain data source fields with links to a cache with references to process control algorithm information and/or process control hardware information to enable displaying information within or in association with the graphical element. To provide system operators with updated information, a path to the associated parameter or function is created within or in association with the graphic. Merely entering a data value into a value field within the process graphic provides a snapshot in time of static system information and, thus, does not provide dynamic system information. For example, if a process graphic displays the volume of fluid in a tank, the graphic may contain a property and/or or data source field for a numeric value representing the fullness of the tank. As described in greater detail below in connection with the example systems and methods, to enable the process graphics to provide dynamic data, the property and/or data field includes or contains a link to the process control parameter associated with tank fullness within the process control algorithm controlling the system that includes the tank. As a result, the graphic displays changes within the tank level as the fluid level in the tank is stored in the cache of process control algorithm information.
- The example methods and apparatus described herein can be used to automatically link data source fields within properties of process graphics to parameters and/or parameters within at least one function of process control algorithm information and/or process control hardware information. Traditionally, process control graphics are created separately from the process control algorithm. For example, a development group may create the process control algorithms using control systems such, for example, as the DeltaV™ control system sold by Fisher-Rosemount Systems, Inc., an Emerson Process Management company. Separately, a different development group may create the process graphics. At some stage, a process graphics designer may need to enter information relating to the data source for the process graphic. Typically, with known systems, the designer enters this information by manually typing the parameter path. Additionally or alternatively, with these known systems, the designer may have the option to use a browsing tool to locate the desired data source. In contrast to these known systems, the example methods and apparatus described herein enable a designer to automatically link process graphics to process control algorithm information using, for example, a drag and drop procedure.
- In an example described herein, a designer may create a process control graphic within a first process control image. The first process control image may be a process control Graphics Studio window that is part of the DeltaV™ control system. The designer also has access to a process control algorithm within a second process control image. The second process control image may be a process control Control Studio window that is part of the DeltaV™ control system. The designer may drag a parameter from the second process control image to the graphic in the first process control image. Upon dropping the parameter onto the graphic, the example method automatically creates a link from the data source field within or associated with the graphic to the parameter. The graphic then accesses the data value within the parameter and displays the value within the graphic as defined by the graphic.
- In another example, the designer may drag a parameter from the second process control image to a first process control image that does not contain a graphic. Upon dropping the parameter onto a first process control image designated for process graphics, but which does not contain such graphics, the example method determines the type of parameter that has been dropped onto the first process control image. The example method then accesses a list of graphic data representations and filters the list based on the type of parameter dropped onto the first process control image. The designer is then prompted with the filtered list of graphics. The designer selects the desired graphic(s) and the example method automatically creates a link from the data source field within the selected graphic(s) to the process control algorithm information. The graphic(s) then accesses the data value within the process control algorithm information and displays the value within the selected graphic(s).
- In yet another example, the designer may highlight or select graphics from the first process control image and drag and drop the selected graphics onto the second process control image. In this example, the second process control image does not yet contain process control algorithm information. In this example, the method determines the types of graphics dragged to the second process control image. From that determination, a function list is filtered with possible process control algorithm functions. The designer selects the function(s) from the list to be created, and the example method creates the function(s) based on definitions within the function list.
- In
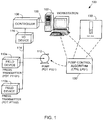
FIG. 1 , an exampleprocess control system 100 that may be used to implement the example methods and apparatus described herein includes a workstation 102 (e.g., an application station, an operator station, etc.) and acontroller 106, both of which may be communicatively coupled via a bus or local area network (LAN) 108, which is commonly referred to as an application control network (ACN). TheLAN 108 may be implemented using any desired communication medium and protocol. For example, theLAN 108 may be based on a hardwired or wireless Ethernet communication scheme, which is well known and, thus, is not described in greater detail herein. However, as will be readily appreciated by those having ordinary skill in the art, any other suitable communication medium and protocol could be used. Further, although a single LAN is shown, more than one LAN and appropriate communication hardware within theworkstation 102 may be used to provide redundant communication paths between theworkstation 102 and a respective similar workstation (not shown). - The
workstation 102 may be configured to perform operations associated with one or more information technology applications, user-interactive applications, and/or communication applications. For example, theworkstation 102 may be configured to perform operations associated with process control-related applications and communication applications that enable theworkstation 102 and thecontroller 106 to communicate with other devices or systems using any desired communication media (e.g., wireless, hardwired, etc.) and protocols (e.g., HTTP, SOAP, etc.). Theworkstation 102 may also be configured to create process control graphics within a graphical interface from the parameters and/or functions of a process control algorithm routine. Theworkstation 102 may be implemented using any suitable computer system or processing system (e.g., theprocessor system 2600 ofFIG. 26 ). For example, theworkstation 102 could be implemented using a single processor personal computer, single or multi-processor workstations, etc. - The
controller 106 may perform one or more process control algorithm routines that have been generated by a system engineer or other system personnel using theworkstation 102 or any other workstation and which have been downloaded to and instantiated in thecontroller 106. Thecontroller 106 may be, for example, a DeltaV™ controller sold by Fisher-Rosemount Systems, Inc., an Emerson Process Management company. However, any other controller could be used instead. Further, while only one controller is shown inFIG. 1 , additional controllers of any desired type or combination of types can be coupled to theLAN 108. - The
controller 106 may be coupled to a plurality of process control devices includingfield devices 110a-b and apump 112 via adigital data bus 114 and an input/output (I/O)device 116. During execution of a process control algorithm routine, thecontroller 106 may exchange information (e.g., commands, configuration information, measurement information, status information, etc.) with thefield devices 110a-b and thepump 112. This information may include parameters within process control algorithm routine functions. For example, thecontroller 106 may be provided with a process control routine that, when executed by thecontroller 106, causes thecontroller 106 to send commands to thefield devices 110a-b and thepump 112 that cause thefield devices 110a-b and thepump 112 to perform specified operations (e.g., perform a measurement, open/close a valve, enable/disable, etc.) and/or to communicate information (e.g., measurement data) via thedigital data bus 114 to thecontroller 106 that can be accessed by theworkstation 102. - In the illustrated example of
FIG. 1 , a pumpprocess control algorithm 120 is configured at theworkstation 102 to define properties and configuration information to control and/or interface with thepump 112 so that thepump 112 can be controlled via theprocess control algorithm 120 and executed by thecontroller 106. To identify theprocess control algorithm 120, it is provided with a name or identifier value (i.e., an identifier value) of CTRL LP01. A graphic 130 displays a value of a parameter within theprocess control algorithm 120. Theprocess control algorithm 120 is linked to the graphic 130 by a path within a data source field of the graphic 130 pointing to a parameter within theprocess control algorithm 120. In this example, the graphic 130 displays the speed of thepump 112 and may be displayed on theworkstation 102. In another example, the graphic 130 may be linked to parameters within process control equipment and/or hardware including theworkstation 102, thecontroller 106, thepump 112, the input/output (I/O)device 116, and or thefield devices 110a-b. In the illustrated example, although thefield devices 110a-b are shown as pressure transmitters, they may be any other type of device including other types of sensors or measurement devices, actuators, etc. In addition, in the illustrated example, thepump 112 may be referred to as equipment. Equipment may also include, for example, tanks, vats, mixers, boilers, heaters, etc. However, for purposes of discussion herein, the terms device and equipment are used interchangeably. - In the illustrated example, the
devices 110a-b and 112 are fieldbus compliant devices configured to communicate via thedigital data bus 114 using the well-known Foundation™ Fieldbus protocol. In accordance with the Foundation™ Fieldbus standard, thedigital data bus 114 is a digital, two-way, multi-drop communication bus configured to be communicatively coupled to measurement and control devices (e.g., thedevices 110a-b and 112). Thedevices 110a-b and 112 are shown communicatively coupled to thedigital data bus 114 in a multi-drop configuration. Thedigital data bus 114 or similar data buses may alternatively be used to communicatively couple field devices to the I/O device 116 using a point-to-point configuration in which one field device is afforded exclusive use of a digital data bus to communicate with the I/O device 116. In alternative example implementations, the methods and apparatus may be used in connection with other types of field devices (e.g., Profibus or HART compliant devices that communicate via thedata bus 114 using the well-known Profibus and HART communication protocols), which may or may not include Fieldbus-compliant devices. - In the illustrated example, the I/
O device 116 is implemented using an I/O subsystem interface that enables connecting thecontroller 106 and thedevices 110a-b and 112 to other field devices, which may use the Fieldbus protocol or other types of communication protocols (e.g., Profibus protocol, HART protocol, etc.). For example, the I/O device 116 may include one or more gateways that translate between the Fieldbus protocol and other communication protocols. Additional I/O devices (similar or identical to the I/O device 116) may be coupled to thecontroller 106 to enable additional groups of field devices to communicate with thecontroller 106. - The example
process control system 100 is provided to illustrate one type of system within which the example methods and apparatus described in greater detail below may be advantageously employed. However, the example methods and apparatus described herein may, if desired, be advantageously employed in other systems of greater or less complexity than the exampleprocess control system 100 shown inFIG. 1 and/or systems that are used in connection with process control activities, enterprise management activities, communication activities, etc. -
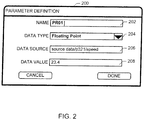
FIG. 2 illustrates an example parameterdefinition user interface 200 that includes aname field 202, adata type field 204, adata source field 206, and adata value field 208. The parameterdefinition user interface 200 enables a system designer to configure information associated with a parameter. Parameters within a process control algorithm enable the process control algorithm to access data transmitted from field devices and/or process control equipment. In the illustrated example, thename field 202, thedata source field 206, and thedata value field 208 are implemented using a text box control. A parameter may contain one or more data source fields 206 and/or data value fields 208. Thedata type field 204 is implemented using a drop-down list control. Thename field 202 can be used to provide a name for a parameter such as, for example, thepump 112 ofFIG. 1 . In the illustrated example, the parameter name provided is 'PR01,' which refers to the parameter being defined as a link to the pump speed data from thepump 112. Thename field 202 may also be used by other parameters, functions, and/or graphics to locate the parameter within a process control algorithm to access the information associated with the parameter. For example, if the parameter with thename field 202 of PR01 is part of a function named PID1, and the function is part of a process control algorithm named CTRL LP01, the path address of the parameter may be <CTRL LP01/PID1/PR01>. Thus, any graphic, function, and/or parameter with a data source field containing the path address, <CTRL LP01/F01/PR01>, may access the data associated with the PR01 parameter. - The
data type field 204 can be used to specify a data type that should be used to store the data from thepump 112. The data sourcefield 206 may be configured to link the parameter to a data source such as, for example, the pump speed data associated with thepump 112. The path within thedata source field 206 may be created by dragging and dropping a graphic associated with thepump 112 to the parameter, browsing a process control path, and/or typing the path. The path enables the parameter to access source data from process control equipment or field devices. For example, thedata source field 206 contains a path to the pump speed data located at, <data source/p321/speed>, thereby enabling the parameter to load the data value associated with this path. The data valuefield 208 displays the corresponding data value, 23.4. Alternatively, the data value may be entered by a system designer, or by a function within a process control algorithm. -
FIG. 3 illustrates an examplegraphic representation 300 that includes a graphic 301, a graphicproperty user interface 304, and an example propertydefinition user interface 307. The graphic 301 enables a visual representation of process control algorithm information. The example graphic 301 depicts a bar graph with text indicating a numerical value associated with the fullness of the bar. Included in the graphic 301 are a firstgraphic field 302 and a secondgraphic field 303. The firstgraphic field 302 and the secondgraphic field 303 may be configured as areas on the graphic 301 where process control algorithm information may be dragged-and-dropped. For example, a parameter dragged-and-dropped onto the firstgraphic field 302 may create a path to the parameter to display the information associated with the parameter in the bar of the graphic 301. A second parameter dragged-and-dropped onto the secondgraphic field 303 may create a path to the second parameter to display the information associated with the second parameter in the text of the graphic 301. A graphic may contain one or more graphic fields. The graphic 301 is shown prior to being linked to process control algorithm information. - In the example implementation, the graphic
property user interface 304 displays a set ofproperties 305 that correspond to the graphic 301. The set ofproperties 305 enables a system designer to configure display information, data sources, and/or any other characteristics associated with process control graphics. Each property within the set ofproperties 305 may contain one or more fields including data source fields to link process control algorithm information, and/or process control hardware information. For example, the height property within the set ofproperties 305 may contain a data source field and/or value field that configures the graphic 301 to be displayed at a specific height. The number and type of properties within the set ofproperties 305 may differ between graphics and/or graphic types. The fields within the properties may be predefined and packaged with process control software, entered by a system designer, and/or linked to process control information. - Process control algorithm information or process control hardware information may be dragged-and-dropped onto a property within the graphic
property user interface 304 in the same manner as process control information may be dragged-and-dropped onto a field within the graphic 301. For example, a parameter may be dragged-and-dropped onto the BACKColor property. The BACKColor property may be configured to display a color within a fill area of the bar chart. A data source field within the BACKColor property then contains a path to the dragged-and-dropped parameter. In a run time environment, the BACKColor property may access the data value associated with the linked parameter and display the corresponding color within the fill area of the graphic 301. This enables the graphic to change the color associated with the BACKColor property as the data within the corresponding parameters changes, enabling dynamic display properties within a graphic. In the example ofFIG. 3 , aproperty definition tab 306 within the set ofproperties 305 opens the propertydefinition user interface 307 including data source fields, value fields, description fields, etc. associated with the graphic 301. Theproperty definition tab 306 may be configured to display the propertydefinition user interface 307 data source fields and corresponding fields related to the primary data fields of the graphic 301. - In the example implementation, the property
definition user interface 307 enables a system designer to configure the information associated with the graphic 301, including linking the graphic 301 to process control algorithm information. The propertydefinition user interface 307 displays data source fields for one or more properties associated with a graphic to reduce the number of images a system designer may open to view or modify data source fields of a graphic. A graphic may contain one or more graphic property user interfaces, where each graphic property user interface may contain information corresponding to the graphic. For example, graphic property user interfaces may contain graphic properties for characterizing graphic display dimensions, shading, palette characteristics, etc. - The property
definition user interface 307 includes aname field 308, adata type field 309, a FillPercentdata value field 310, an OUTdata value field 311, agraphic description field 312, acategory field 313, a FillPercentdata source field 314, and an OUTdata source field 315. Thedata type field 309 and thecategory field 313 are implemented using drop-down list controls, while thename field 308, the FillPercentdata value field 310, the OUT data valuefield 311, thegraphic description field 312, the FillPercentdata source field 314, and the OUT data sourcefield 315 are implemented using a text box control. Thename field 308 can be used to provide a name for a graphic. In the illustrated example, the parameter name provided is 'PUMP SPEED BAR CHART,' which refers to the graphic 301 defined as a visual representation of the pump speed of thepump 112. Thedata type field 309 can be used to specify a data type that should be used to display the data from thepump 112. The fields within the propertydefinition user interface 307 may be configured by a system designer and/or predefined and packaged with process control software. - The FillPercent
data value field 310 and the OUT data valuefield 311 may contain a data value utilized by the graphic 301 to visually represent data. There may be one or more data value fields depending on the type of graphic. For example, a valve graphic may contain two data value fields, one field for the status of the value and a second field for the fluid flow rate through the valve. Thegraphic description field 312 may be configured to contain text entered as notes by a system designer. Thecategory field 313 displays the type of the graphic 301. In this example, thecategory field 313 displays 'Single Bar Chart Graphic,' indicating the graphic 301 is a single bar graph. A system designer may select a different graphic from the drop-down list to change the type of the graphic 301 and/or information contained in the propertydefinition user interface 307. - The FillPercent
data source field 314 and the OUT data sourcefield 315 within the propertydefinition user interface 307 may reference the FillPercent and the OUT properties within the set ofproperties 305. For example, the FillPercent property within the set ofproperties 305 may contain a data source field to link the firstgraphic field 302 to process control algorithm information. This data source field may additionally be displayed within the propertydefinition user interface 307 as the FillPercentdata source field 314. - The FillPercent
data source field 314 and the OUT data sourcefield 315 contain paths to process control algorithm information. The graphic 301 may visually represent the data associated with the path in the datafirst source field 314 and the OUT data sourcefield 315. The path may point to a parameter, such as the parameter described inFIG. 2 , or to process control algorithm information referenced within a source address cache, enabling the graphic 301 to access data within the parameter or the path within the source address cache. The source address cache may contain a list of addresses to process control information transmitted by field devices and/or process control equipment. The path in the FillPercentdata source field 314 may be created by dragging and dropping a parameter onto the firstgraphic field 302 of graphic 301, browsing a process control path for a parameter, typing the path and/or dragging and dropping a parameter onto the FillPercent property within the set ofproperties 305. In this example, the FillPercentdata source field 314 contains the path, <CTRL LP01/PID01/PR01>, which points to the process control algorithm CTRL LP01, which includes a function PID01 that contains the parameter PR01 ofFIG. 2 . Thus, the FillPercentdata source field 314 is used to access and load the data (e.g., 23.4) associated with the PR01 parameter. - The path in the OUT data source
field 315 may be created by dragging and dropping a parameter onto the secondgraphic field 303 of the graphic 301, browsing a process control path for a parameter, typing the path and/or dragging and dropping a parameter onto the OUT property within the set ofproperties 305. In this example, the OUT data sourcefield 315 contains the path, <CTRL LP01/PID01/PR02>, which points to the process control algorithm CTRL LP01, which includes the function PID01 that contains the parameter PR02. - In this example, the FillPercent
data source field 314 and the OUT data sourcefield 315 contain paths to parameters PR01 and PR02. However, the FillPercentdata value field 310 and the OUT data valuefield 311 contain data values 0.00. This is a result of creating the graphic 301 in a design environment. In an example where the graphic 301 is processed in a run time environment, the FillPercentdata value field 310 and OUT data valuefield 311 may contain data values associated with the paths within the FillPercentdata source field 314 and the OUT data sourcefield 315 that point to data values from process control equipment such as, for example, thepump 112 ofFIG. 1 . - In another example, if one parameter is dragged-and-dropped to a graphic field within a graphic with more than one unlinked data source field, all of the unlinked data source fields within the graphic may link to the dragged-and-dropped parameter. Then, if a second parameter is dropped onto a graphic field within the graphic, only the data source field associated with the graphic field may contain a link to the second parameter.
-
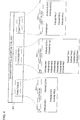
FIG. 4 illustrates a block diagram of an exampleprocess control algorithm 400. The exampleprocess control algorithm 400 is utilized by thecontroller 106 ofFIG. 1 to execute a predefined set of functions to control and monitor devices within a control system. The exampleprocess control algorithm 400 contains aninput function 402, aprocessing function 404, and anoutput function 406. In other examples, an algorithm block may contain one or more functions. A function may contain a nested function which, in turn, may contain one or more nested functions. Each function performs a predefined routine associated with a process control system. The functions within a process control algorithm may or may not share data between their associated parameters. Typically, a function is configured to execute a specific type of task. For example, a first function may collect and filter analog input data, a second function may process the collected and filtered data according to a set of rules, and a third function may provide feedback control for a physical device. - In the example
process control algorithm 400, the functions 402-406 contain input parameters, output parameters and intermediate parameters. In other example implementations, the functions 402-406 may contain zero or more of each type of parameter in addition to other parameter types. The parameters within a function enable the function to link to data sources not contained within the function. A parameter may contain a link to a source address cache containing addresses to field devices that may transmit process control algorithm information such as, for example, data transmitted from field devices (e.g. thedevices FIG. 1 ) and/or process control devices (e.g., pump 112). Additionally, a parameter may link to another parameter within a different function. In the example ofFIG. 4 , theprocess control algorithm 400 contains an identifier, CTRL LP01. The functions 402-406 that make up theprocess control algorithm 400 contain their own identifiers, AI1 for theinput function 402, PID1 for theprocessing function 404, and AO1 for theoutput function 406. Additionally, the functions 402-406 contain function types, AI for theinput function 402, PID for theprocessing function 404 and AO for theoutput function 406. The function type associates a classification with a function. The function type may be used by a graphics list filter to determine corresponding graphics if a function is dragged-and-dropped to a process control graphic image. For example, a function type of PID may classify a function as a proportional-integral-derivative feedback control algorithm. If this function is dragged-and-dropped to a process control graphic image, a graphics list filter prompts a user with a list of graphics that corresponds to the PID function. - Within each function, the parameters contain their own identifiers stored in the
name field 202 ofFIG. 2 . For example, theinput function 402 includes parameters IN01, PR01, PR02, and OUT01. The IN01 parameter may be located at a hierarchical path location of <CTRL LP01/AI01/PR01>. If the IN06 parameter of theprocessing function 404 is configured to access the data in the PR01 parameter within theinput function 402, the IN06 parameter contains <CTRL LP01/PID01/PR01> in thedata source field 206. The parameters included in a function may also associate with the corresponding function type. For example, the parameter IN01 included in theinput function 402 may be associated with the AI function type. A graphics filter may use the function type associated with a dragged-and-dropped parameter to create a list of corresponding graphics. In another example, a parameter in a first function may be connected or linked to a parameter in a second function by creating a wire between the parameters to be linked within the first and second functions. - In an example, the
input function 402 may be configured to convert raw data associated with a pump speed of thepump 112 to a refined numerical value. Theinput function 402 loads the raw data value from the input parameter PARAM IN01 that contains a path to the pump speed analog data referenced within the source address cache. Theinput function 402 then processes the pump speed analog data to generate a numerical pump speed value and stores the numerical pump speed value to thedata value field 208 of the output parameter, PARAM OUT01. The intermediate parameters PARAM PR01 and PARAM PR02 may contain data associated with the processing of the pump speed raw data, such as a mathematical overflow flag or a fractional remainder from a division calculation. Theprocessing function 404 may access the numerical pump speed value through the path within thedata source field 206 of the input parameter PARAM IN04 to link to the output parameter PARAM OUT01 of theinput function 402. For example, thedata source field 206 of the input parameter PARAM IN04 may contain the path </CTRL LP01/AI1/ PARAM PR01> to link to the output parameter PARAM OUT01 of theinput function 402. -
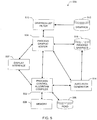
FIG. 5 is a block diagram of anexample apparatus 500 that may be used to automatically link process control algorithm information to process control graphics. Theexample apparatus 500 includes a processcontrol algorithm compiler 502, a processgraphic editor 504, a process controlsource address cache 506, adisplay interface 507, amemory 508, agraphics list filter 510, agraphics cache 512, anauto path generator 514, and aprocess graphics cache 516, all of which may be communicatively coupled as shown or in any other suitable manner. A system designer may utilize theexample apparatus 500 to create and edit process graphics from process control algorithm information within a design environment. The design environment may be an offline workstation that is separate from the run time environment, or an online workstation such as theworkstation 102 depicted inFIG. 1 . By having a separate design environment a system designer may configure a user interface that may not be modified by system operators who may only have access to the run time environment. - The
example apparatus 500 may be implemented using any combination of hardware, firmware, and/or software. For example, one or more integrated circuit(s), programmable processor(s), application specific integrated circuit(s) (ASIC(s)), programmable logic device(s) (PLD(s)), field programmable logic device(s) (FPLD(s)), discrete semiconductor component(s), or passive electronic component(s), etc may be used. Additionally or alternatively, some or all of the blocks of theexample apparatus 500, or parts thereof, may be implemented by instructions, code, and/or other combination of software and/or firmware, etc. stored on a machine accessible medium that, when executed by, for example, a processor system (e.g., theprocessor system 2600 ofFIG. 26 ) perform the operations represented in the flow diagrams ofFIGS. 24A-24D and25 . Although theexample apparatus 500 is described as having one of each block described below, theexample apparatus 500 may be provided with two or more of any block described below. In addition, some blocks may be disabled, omitted, duplicated, or combined with other blocks. - In the illustrated example, the process
control algorithm complier 502 is communicatively coupled to the process controlsource address cache 506, thememory 508, the processgraphic editor 504, thedisplay interface 507, and theauto path generator 514. In this example implementation, the processcontrol algorithm complier 502 is configured to load a process control application from thememory 508 and process control algorithm information and/or source data referenced within the process controlsource address cache 506 to create a process control algorithm that may be used to monitor and/or control a system and/or a process in a run time environment. The process control algorithm, which may be similar to theprocess control algorithm 400 ofFIG. 4 , includes at least one process control function containing at least one process control parameter. The process control functions and/or parameters may be configured to reference process control algorithm information referenced within the process controlsource address cache 506. - The process control
source address cache 506 is a storage device and/or memory that may be configured to store addresses to process control algorithm information from a plurality of communicatively coupled field devices such as, for example, thefield devices pump 112 ofFIG. 1 . Process control information may contain field device status, measurement data, sensor data, etc. The process controlsource address cache 506 is a reference storage device for the process control algorithm. This enables more than one process control algorithm to access the same process control algorithm information without needing to duplicate the process control algorithm information. - The
display interface 507 may display a process control image of the processcontrol algorithm compiler 502, enabling a system designer to create and/or modify process control algorithm functions and/or parameters including modifying the control of a function, adding a path within a parameterdata source field 206, creating links between parameters in different functions, etc. The process control image may include an application window, graphical interface window, etc. A process control algorithm may be created by the system designer, within a design environment such as, for example, the DeltaV™ Control Studio™ sold by Fisher-Rosemount Systems, Inc., an Emerson Process Management company. - In the example implementation, the process
control algorithm compiler 502 may be coupled to the processgraphic editor 504 when at least one process control algorithm function and/or parameter is selected (e.g., dragged) from the process control algorithm within the processcontrol algorithm compiler 502 and dropped onto a graphic included in a process control image within the processgraphic editor 504. The selected function and/or parameter may also be dropped onto a process control image without a graphic. This drag-and-drop action enables a system designer to automatically link data sources within selected process control functions and/or parameters included in the processcontrol algorithm compiler 502 to one or more graphics within the processgraphic editor 504. This drag-and-drop action may additionally include other example implementations such as select-and-paste, copy-and-paste, highlight-and-paste, box-and-move, lasso-and-insert, etc. For purposes of discussion herein, terms describing the drag-and-drop action are used interchangeably. - Another example implementation may contain more than one process
control algorithm compiler 502. In such an implementation, a system designer may drag-and-drop at least one process control algorithm function and/or parameter from a first processcontrol algorithm compiler 502 to a processgraphic editor 504, and drag-and-drop at least one process control algorithm function and/or parameter from a second processcontrol algorithm compiler 502 to the same processgraphic editor 504. In this example implementation, the processgraphic editor 504 contains graphics with links to the first and second process control algorithm compliers. - The
display interface 507 may display a process control image of the processgraphic editor 504 enabling a system designer to create and manage process control graphics for use within a process control graphical interface. The process control graphical interface provides a visual representation of process control algorithm information that may be used by system operators to monitor and/or control a system. The processgraphic editor 504 is communicatively coupled to thegraphics list filter 510, theauto path generator 514, theprocess graphics cache 516, and the processcontrol algorithm complier 502. In the example implementation, thedisplay interface 507 displays the image of a processgraphic editor 504 using graphics. The process control image may include an application window, graphical interface window, etc. A graphic may be selected from thegraphics cache 512 or manually created by the system designer using, for example, the DeltaV™ Graphics Studio™ sold by Fisher-Rosemount Systems, Inc., an Emerson Process Management company. Thegraphics cache 512 contains saved generic graphics such as a bar graph, pump parameters, a pie chart, etc. The generic graphics may be created by a system designer and/or predefined and packaged with process control software. - In an example implementation, the process
graphic editor 504 accesses thegraphics list filter 510 when process control algorithm information is dragged-and-dropped into a process control image within the processgraphic editor 504. In one example, the processgraphic editor 504 may not contain a graphic to associate with the dragged-and-dropped process control algorithm information. In this example, the processgraphic editor 504 communicates the type of dragged-and-dropped process control algorithm information to thegraphics list filter 510, such as information contained in thedata type field 204 ofFIG. 2 , the data in thename field 202, the function type associated with the parameter and/or any other process control algorithm information that may be associated with a parameter and/or parameter(s) within a function. Thegraphics list filter 510 compiles the parameter information and accesses a filter look-up table. The look-up table may be a list of combinations of parameter information with a cross reference to combinations of graphic type information. The graphic type information may include data within thedata type field 309 ofFIG. 3 and/or thecategory field 313. The graphic type information may correspond to one or more graphics. In the case a parameter contains more than onedata source field 206 and/or more than one parameter is dragged-and-dropped onto the process control graphic image and/or graphic, the processgraphic editor 504 may display a list of parameters and/or data source fields 206. A system designer may select the data source fields 206 and/or parameters to be linked to a graphic. - In an example implementation, a parameter with a data type field of FLOATING POINT and an associated function type of PID is dragged-and-dropped to a process control graphic image. The
graphics list filter 510 may compile the FLOATING POINT and PID information and access the filter look-up table. In this example, a combination of FLOATING POINT and PID cross references to graphics with data types of FLOATING POINT and/or DOUBLE FLOATING POINT, and a category field containing PUMP, VALVE, MOTOR, TUNING PARAMS, and/or OVERVIEW. Thegraphics list filter 510 accesses thegraphics cache 512 and determines the graphics that include a data type field of FLOATING POINT and/or DOUBLE FLOATING POINT and a category field with PUMP, VALVE, MOTOR, TUNING PARAMS, and/or OVERVIEW. The matched and/or similar graphics are then transmitted by thegraphics list filter 510 to theprocess graphics editor 504 to be displayed within a prompt list. The processgraphic editor 504 then loads the user selected graphic(s) and notifies theauto path generator 514. - The
graphics list filter 510 may transmit a prompt list including all graphics within thegraphics cache 512 if a match cannot be made between the parameter information and the graphic type information. In another implementation, thegraphics list filter 510 may return an empty prompt list and/or error message if a match cannot be made between the parameter information and the graphic type information. When parameter information and graphic type information are not cross referenced within the filter look-up table, a user may create the cross reference by editing the filter look-up table. Additionally, thegraphics list filter 510 may create a cross reference between parameter information and graphic type information when a user drags-and-drops a parameter onto a graphic. The parameter information, graphic type information, and/or cross reference included within a filter look-up table may be created by a system designer or predefined and packaged with process control software. In another example implementation, the filter look-up table may contain a direct association of graphics and parameters. For example, a parameter PR01 may be cross referenced to a graphic with a category field of SINGLE BAR CHART GRAPHIC. - In the
example apparatus 500, the processgraphic editor 504 and the processcontrol algorithm compiler 502 are communicatively coupled to theauto path generator 514. Theauto path generator 514 is configured to automatically create a link from the graphics within the processgraphic editor 504 to the process control algorithm information within the processcontrol algorithm compiler 502. In particular, theauto path generator 514 receives a notification from the processgraphic editor 504 that at least some process control algorithm information was dragged-and-dropped to a graphic. The notification may include a graphic identifier, a parameter identifier and/or a function identifier of the dragged-and-dropped process control algorithm information. Theauto path generator 514 then accesses the processcontrol algorithm compiler 502 and copies the path information of the process control algorithm information parameter and/or function. Theauto path generator 514 stores the path location or path in the FillPercentdata source field 314 ofFIG. 3 of a graphic. This enables the graphic to access the process control algorithm information contained in the process control algorithm parameter and/or function. - In an example, a system designer may select a pump speed process control parameter, PS25, included in function PID1 within a process control algorithm CTRL LP01, and drop the PS25 parameter onto a bar chart graphic labeled BC01 within an image of the process
graphic editor 504 displayed in thedisplay interface 507. The bar chart graphic BC01 includes adata source field 314, configured for a numeric value to display the height of a bar in the bar chart BC01. The processgraphic editor 504 notifies theauto path generator 514 of the graphic BC01, the PS25 parameter, the CTRL LP0 process control algorithm, and the PID1 function. Theauto path generator 514 accesses the CTRL LP01 process control algorithm and searches for the PID1 function. Within the PID1 function, theauto path generator 514 searches for the PS25 parameter. Theauto path generator 514 then copies the path associated with the PS25 parameter (e.g. <CTRL LP01/PID01/PR01>). Theauto path generator 514 then accesses the BC01 graphic and pastes the path into thedata source field 314. In the runtime environment, the BC01 graphic uses the path in the FillPercentdata source field 314 to access the PS25 parameter data valuefield 208 to display a bar height associated with the pump speed. - In another example implementation, when the process control algorithm parameter contains path data within the process control
source address cache 506, theauto path generator 514 may copy the path of the reference within the process controlsource address cache 506 and/or the parameter path. In this example, the data value within the graphic will be the same value regardless of whether the graphic property path is linked to a parameter within the process control algorithm or to the reference within process controlsource address cache 506. - The process
graphic editor 504 may be configured to load graphics from theprocess graphics cache 516. Theprocess graphics cache 516 is a storage device and/or memory configured to save process control graphics created using the processgraphic editor 504. The process control graphics saved in theprocess graphics cache 516 may include saved graphics that have been linked to process control algorithm information. In the exampleprocess control system 100 ofFIG. 1 , an operator using theworkstation 102 may view a graphical interface display of a process control system including the process control graphics saved in theprocess graphics cache 516. -
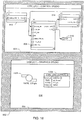
FIG. 6 illustrates an exampleprocess control environment 600 including adisplay 602 containing a processcontrol algorithm image 604 and a process controlgraphic image 606. The process controlalgorithm information image 604 and/or the process controlgraphic image 606 may be a graphical user interface, application window, etc. Thedisplay 602 may include one or more computer workstation displays and the process controlalgorithm information image 604 may be included in a different display than the process controlgraphic image 606. The processcontrol algorithm image 604 contains information from the processcontrol algorithm compiler 502 ofFIG. 5 , and the process controlgraphic image 606 contains information from the processgraphic editor 504 ofFIG. 5 . Although thedisplay 602 is described as having one processcontrol algorithm image 604 and one process controlgraphic image 606, thedisplay 602 may include two or more process control algorithm images and/or process control graphic images. - The process
control algorithm image 604 named CTRL LP01 includes a process control algorithm that containsfunctions functions analog input function 612, a processing orPID control function 608, and ananalog output function 614. Although the process controlalgorithm information image 604 is described as having one of each block described below, the process controlalgorithm information image 604 may include two or more of any block described below. - In the example implementation, the
input function 612 provides an input value to theprocessing function 608. Theprocessing function 608 is configured to have inputs from other functions and/or parameters, and outputs to various other functions and/or parameters. Theprocessing function 608 processes the data from theinput function 612 and theoutput function 614 to create a value specified in the data value field of anoutput parameter 610. Additionally, theoutput function 614 utilizes the output from theprocessing function 608 as an input. For example, theprocessing function 608 is a PID feedback control algorithm configured to provide output flow control for thepump 112 ofFIG. 1 within theprocess control system 100. In that case, theinput function 612 may access the process controlsource address cache 506 to load the value of a fluid flow rate from thepump 112. The value may be a raw number or value collected by a sensor associated with an output of thepump 112. Theinput function 612 sends the fluid flow value to theprocessing function 608. Theprocessing function 608 calculates a meaningful rate value from the raw data from the sensor and sends the calculated fluid flow rate to theoutput function 614. Theprocessing function 608 may also use the feedback from theoutput function 614 to provide control adjustments to the fluid flow within thepump 112 based on differences between the specified or desired and measured flow values. Theoutput function 614 compares the fluid flow rate of thepump 112 to an operator specified target value and returns the difference to theprocessing function 608. Theoutput parameter 610 is configured to report the fluid flow rate as a parameter within the process control algorithm. - The example process control
graphic image 606 within thedisplay 602 includes agraphic image area 616 containing a graphic 617, which includes atext data representation 618, and a visualgraphical data representation 620. The graphic 617 may have a corresponding graphic property user interface similar to the propertydefinition user interface 307 ofFIG. 3 and may have been loaded from thegraphics cache 512 ofFIG. 5 or created manually. Thetext data representation 618 is configured to display a value within a property field associated with the graphic 617. The visualgraphical data representation 620 is configured to display an area fill of the bar associated with the value within a property field associated with the graphic 617. In the example implementation, the graphic 617 has not yet been linked to a data source and, thus, thetext data representation 618 and thegraphical data representation 620 are shown with a null data value. As described in greater detail below, the graphic 617 is linked with a data value by selecting theoutput parameter 610, dragging theoutput parameter 610 to thegraphic image area 616 of the process controlgraphic image 606, and dropping theoutput parameter 610 on the graphic 617. -
FIG. 7 illustrates the processcontrol algorithm image 604 ofFIG. 6 linked to the process controlgraphic image 606 ofFIG. 6 . InFIG.7 , the process controlgraphic image 606 depicts the process controlgraphic image 606 ofFIG. 6 with theoutput parameter 610 as automatically linked to a data source field associated with the graphic 617. The automatic linking, which was initiated by selecting-and-dragging theoutput parameter 610 to the graphic 617, is performed by theauto path generator 514 ofFIG. 5 . As a result of the automatic linking, the data source fields within the graphic 617 contain the path associated with theoutput parameter 610. Thus, during runtime, the graphic 617 stores the data value associated with theoutput parameter 610 path in thedata value field 310 associated with the graphic 617. Additionally, thetext data representation 618 now displays a text value associated with the value within the data value field associated with the graphic 617. Similarly, thegraphical data representation 620 now displays a portion of the bar filled to visually depict the value associated with the value within the data value field associated with the graphic 617. In this manner, the graphic 617 ofFIG. 7 shows, for example, the fluid flow rate of thepump 112. -
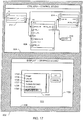
FIG. 8 illustrates a processcontrol algorithm image 804, which is similar to the processcontrol algorithm image 604 ofFIG. 6 , but which contains aconcentration function 816 that includes four output parameters CONC_01-CONC_04 and fourinput parameters 815. Thedisplay 602 also includes a process controlgraphic image 806, which is similar to the process controlgraphic image 606, but which contains two graphics. In particular, the process controlgraphic image 806 includes the graphic 617 and a second graphic 821. Additionally, the process controlalgorithm information image 804 includes a process control algorithm including thefunctions concentration function 816 includes a function type of CALC, indicating the function block is configured to perform calculations. Although the controlalgorithm information image 804 is described as having one of each function described below, the process controlalgorithm information image 804 may include two or more of any function described below. - In the example implementation, the
input function 612, theprocessing function 608, and theoutput function 616 are configured as described above in connection withFIG. 6 . In this example implementation, the feedback control algorithm depicted in the processcontrol algorithm image 804 is configured to provide flow control for a pump (e.g., the pump 112) within a process control system (e.g., the process control system 100). The process control algorithm includes theoutput parameter 610, which includes a path to the fluid flow rate that is associated with the pump and which is referenced in the process controlsource address cache 506 ofFIG. 5 , and theconcentration function 816, which includes the fourinput parameters 815 containing paths to the chemical concentrations of the fluid within the pump. The four parameters associated with theconcentration function 816 may access the process controlsource address cache 506 to reference addresses of sensors transmitting chemical concentrations of the fluid within the pump. The chemical concentration data source may be transmitted to the fourinput parameters 815 by one or more sensors in close proximity to the pump. Theconcentration function 816 may process the concentration data source from the fourinput parameters 815 to determine concentration percentages of one or more chemical constituents of the fluid in the pump. - The example process control
graphic image 806 within thedisplay 602 includes agraphic image area 820 containing the second graphic 821 and the graphic 617 ofFIG. 6 , which includes thetext data representation 618, and thegraphical data representation 620. The graphic 617 and the second graphic 821 may be loaded from thegraphics cache 512 ofFIG. 5 or created manually. The second graphic 821 includes a secondtext data representation 824 and a secondgraphical data representation 822. The secondtext data representation 824 is configured to display a value within a property field associated with the second graphic 821. The visualgraphical data representation 822 is configured to display an area fill of a pie chart associated with the value(s) within a property field associated with the second graphic 821. In the example ofFIG. 8 , the graphic 617 and the second graphic 821 have not yet been linked to a data source. As a result, thetext data representation 618, thegraphical data representation 620, the secondtext data representation 824, and the secondgraphical data representation 822 are displayed with null data values. - In the example, the graphic 617 is linked to a data value by selecting the
output parameter 610, and dragging theoutput parameter 610 to and dropping it on the graphic 617. Similarly, the second graphic 821 is linked to the four parameters (e.g. CONC_01 - CONC_04) within theconcentration function 816 by selecting and dragging theconcentration function 816 to and dropping it on the second graphic 821. Theoutput parameter 610 and the four parameters within theconcentration function 816 may be selected individually and dragged to and dropped on the corresponding graphics. In another example, theoutput parameter 610 and the four parameters within theconcentration function 816 may be selected together and dragged to thegraphic image area 820. In this case, the processgraphic editor 504 ofFIG. 2 may prompt a system designer to specify which parameter to link to which graphic. -
FIG. 9 illustrates the processcontrol algorithm image 804 ofFIG. 8 and the process controlgraphic image 806 ofFIG. 8 . InFIG. 9 , the process controlgraphic image 806 depicts the process controlgraphic image 806 ofFIG. 8 with theoutput parameter 610 as automatically linked to a data source field associated with the graphic 617 and the four parameters within theconcentration function 816 as automatically linked to a data source field associated with the second graphic 821. The automatic linking, which was initiated by selecting-and-dragging theoutput parameter 610 to the graphic 617 and theconcentration function 816 to the second graphic 821, is performed by theauto path generator 514 ofFIG. 5 . As a result of the automatic linking, the data source field within the graphic 617 contains the path associated with theoutput parameter 610. Similarly, the four data source fields within the second graphic 821 contain paths associated with the four parameters within theconcentration function 816. Thus, during runtime, the graphic 617 loads the data value associated with theparameter 610 in the data value field associated with the graphic 617. In the same manner, the second graphic 821 stores the data values associated with the four parameters within theconcentration function 816 in the data value fields associated with the second graphic 821. Additionally, thetext data representation 618 now displays a text value associated with the value within the data value field associated with the graphic 617. Similarly, thegraphical data representation 620 now displays a portion of the bar filled to visually depict the value associated with the value within the data value field associated with the graphic. The secondgraphical data representation 822 now displays a pie chart visually depicting the values associated with the values within the data value field associated with the second graphic 821. Additionally, the secondtext data representation 824 now contains the numerical percentage values and the chemical types within the fluid. In this manner, the graphic 617 ofFIG. 9 shows, for example, the fluid flow rate from the pump, and the graphic 821 ofFIG. 9 shows, for example, the constituents of the fluid in the pump. -
FIG. 10 illustrates the processcontrol algorithm image 604 ofFIG. 6 , the process controlgraphic image 606 ofFIG. 6 , and a graphicproperty user interface 1030. The process controlalgorithm information image 604 includes a process control algorithm including thefunctions algorithm information image 604 is described as having one of each block described below, the process controlalgorithm information image 604 may include two or more of any block described below. - In the example implementation, the
input function 612, theprocessing function 608, and theoutput function 614 are configured as described above in connection withFIG. 6 . In this example implementation, the feedback control algorithm depicted in the processcontrol algorithm image 604 is configured to provide flow control for a pump within a process control system. The process control algorithm includes theoutput parameter 610 that includes a path to the fluid flow rate from the pump referenced in the process controlsource address cache 506 ofFIG. 5 . The example process controlgraphic image 606 within thedisplay 602 includes thegraphic image area 616 not containing a graphic. Theoutput parameter 610 has not yet been dragged and dropped into the process controlgraphic image 606. - The example process control
graphic image 606 within thedisplay 602 includes thegraphic image area 616 containing the graphic 617 ofFIG. 6 , which includes thetext data representation 618, and thegraphical data representation 620. The graphic 617 may be loaded from thegraphics cache 512 ofFIG. 5 or created manually. The graphic 617 includes ahighlight 1019 that includes four squares in close proximity to the graphic 617 indicating selection of the graphic 617. The graphic 617 may be selected by clicking on the graphic 617. In this example, by selecting the graphic 617 a system designer opens the graphicproperty user interface 1030 associated with the graphic 617. The graphicproperty user interface 1030 may be similar to the graphicproperty user interface 304 ofFIG. 3 . - In the example implementation, one or more of the
functions output parameter 610 may be dragged-and-dropped onto one or more of the properties within the graphicproperty user interface 1030. By dragging-and-dropping process control algorithm information onto a property within the graphicproperty user interface 1030, one or more data source fields within the property may be linked to the dragged-and-dropped process control algorithm information. Additionally a system designer may open a property within the graphicproperty user interface 1030 and drag-and-drop process control algorithm information onto a data source field within a property definition user interface such as, for example, the propertydefinition user interface 307 ofFIG. 3 . In the example ofFIG. 10 , the graphic 617 is linked to a data value by selecting theoutput parameter 610, and dragging theoutput parameter 610 to and dropping it on the OUT property within the graphicproperty user interface 1030. Additionally, by dropping theparameter 610 onto the OUT property, the FillPercent property may automatically include the same link to the dragged-and-droppedparameter 610. The OUT property corresponds to thetext data representation 618 and the FillPercent property corresponds to thegraphical data representation 620. -
FIG. 11 illustrates the processcontrol algorithm image 604 ofFIG. 6 linked to the process controlgraphic image 606 ofFIG. 6 . InFIG.11 , the process controlgraphic image 606 depicts the process controlgraphic image 606 ofFIG. 6 with theoutput parameter 610 as automatically linked to a data source field associated with the graphic 617. The automatic linking, which was initiated by selecting-and-dragging theoutput parameter 610 to the OUT property within the graphicproperty user interface 1030, is performed by theauto path generator 514 ofFIG. 5 . As a result of the automatic linking, the data source fields within the graphic 617 contain the path associated with theoutput parameter 610. Thus, during runtime, the graphic 617 stores the data value associated with thisparameter 610 path into thedata value field 310 associated with the graphic 617. Additionally, thetext data representation 618 now displays a text value associated with the value within the data value field associated with the graphic 617. Similarly, thegraphical data representation 620 now displays a portion of the bar filled to visually depict the value associated with the value within the data value field associated with the graphic 617. In this manner, the graphic 617 ofFIG. 11 shows, for example, the fluid flow rate of thepump 112. -
FIG. 12 illustrates the processcontrol algorithm image 604 ofFIG. 6 , and the process controlgraphic image 606 ofFIG. 6 , which does not contain a graphic within thegraphic image area 616. The process controlalgorithm information image 604 includes a process control algorithm including thefunctions algorithm information image 604 is described as having one of each block described below, the process controlalgorithm information image 604 may include two or more of any block described below. - In the example implementation, the
input function 612, theprocessing function 608, and theoutput function 614 are configured as described above in connection withFIG. 6 . In this example implementation, the feedback control algorithm depicted in the processcontrol algorithm image 604 is configured to provide flow control for a pump within a process control system. The process control algorithm includes theoutput parameter 610 that includes a path to the fluid flow rate from the pump referenced in the process controlsource address cache 506 ofFIG. 5 . The example process controlgraphic image 606 within thedisplay 602 includes thegraphic image area 616 not containing a graphic. Theoutput parameter 610 has not yet been dragged and dropped into the process controlgraphic image 606. -
FIG. 13 illustrates the processcontrol algorithm image 604 ofFIG. 6 and the process controlgraphic image 606 ofFIG. 6 , which contains a graphical userinterface prompt list 1320. The example graphical userinterface prompt list 1320 includes anOK button 1322, a CANCELbutton 1324, agraphics list box 1326, and graphics 1328-1332. The graphics 1328-1332 displayed in thegraphics list box 1326 are transmitted from thegraphics list filter 510 ofFIG. 5 based on the function and/or parameters dragged-and-dropped into thegraphic image area 616. - In the example of
FIG. 13 , the process control algorithm including theinput function 612, theprocessing function 608, theoutput function 614, and theoutput parameter 610 ofFIG. 12 , have been selected and dropped into thegraphic image area 616 ofFIG. 12 . Thegraphics list filter 510 determines the information contained within theinput function 612, theprocessing function 608, theoutput function 614, and theoutput parameter 610 and filters graphics included in thegraphics cache 512 that match or correspond to the dragged-and-dropped process control algorithm information. The matching or corresponding graphics 1328-1332 are displayed in the graphical userinterface prompt list 1320. The graphics 1328-1332 may be displayed as text, visual graphical representations, or any other possible representation of graphics. In this example, the 'Tuning Params' graphic 1331 is selected. In other example implementations, multiple graphics may be selected. The selected graphic 1331 has not yet been linked to the process control algorithm information. -
FIG. 14 illustrates thedisplay 602 ofFIG. 6 containing the processcontrol algorithm image 604 and the process controlgraphic image 606 ofFIG. 6 , which includes the visual representation of the graphic 1331 ofFIG 13 . The graphic 1331 is automatically linked to one or more parameters and/or parameter(s) within one or more function(s) within the process control algorithm contained in the processcontrol algorithm image 604. The graphic 1331 includes process control data values associated with GAIN, RATE, and RESET that may be loaded from the process controlsource address cache 506, calculated, and/or processed within the functions within the process control algorithm. In this example, the text data within the graphic 1331 contains a first data source field for RATE, a second data source field for GAIN, and a third data source field for RESET. Theauto path generator 514 ofFIG. 5 links paths from parameters within theinput function 612, theprocessing function 608, and theoutput function 612 to the corresponding data source fields within the graphic 1331. In this example, the data source fields associated with the graphic 1331 are matched automatically by theauto path generator 514 to the process control algorithm information within the processcontrol algorithm image 604. However, in another example implementation, there may be more than one possible parameter and/or function within a process control algorithm to link to a data source field within a graphic. In this case, the processgraphic editor 504 may provide a list of possible parameters and/or parameter(s) within one or more function(s) that match the data source field within the graphic. -
FIG. 15 illustrates the processcontrol algorithm image 604 ofFIG. 12 and the process controlgraphic image 606 ofFIG. 12 , which contains the graphical userinterface prompt list 1320 ofFIG. 13 . The example graphical userinterface prompt list 1320 includes graphics 1328-1332. The graphics 1328-1332 displayed in the graphical userinterface prompt list 1320 are transmitted from thegraphics list filter 510 ofFIG. 5 based on the function and/or parameters dragged-and-dropped into thegraphic image area 616. - In the example, the process control algorithm including the
input function 612, theprocessing function 608, theoutput function 614, and theoutput parameter 610 ofFIG. 12 , have been selected and dropped into thegraphic image area 616 ofFIG. 12 . Thegraphics list filter 510 determines the information contained within theinput function 612, theprocessing function 608, theoutput function 614, and theoutput parameter 610 and filters graphics included in thegraphics cache 512 with property fields that match the dragged-and-dropped process control algorithm information, as described above inFIG. 12 . The matching graphics 1328-1332 are displayed in the graphical userinterface prompt list 1320. In the example ofFIG. 15 , the pump graphic 1328 and the overview graphic 1332 are selected. The pump graphic 1328 may display the fluid flow rate through a pump within a process control system controlled by the process control algorithm within the processcontrol algorithm image 604. The overview graphic 1332 may display the fluid flow rate and the status within the same process control system as the pump within the processcontrol algorithm image 604. The selectedgraphics -
FIG. 16 illustrates thedisplay 602 containing the processcontrol algorithm image 604 and the process controlgraphic image 604 ofFIG. 12 , which contains visual graphical representations the pump graphic 1328 and the overview graphic 1332. The pump graphic 1328 and the overview graphic 1332 are automatically linked to one or more parameters and/or functions within the process control algorithm contained in the processcontrol algorithm image 604. In this example, the pump graphic 1328 displays a fluid flow of 2.5 g/s through a pump that may be associated with a data source parameter within theprocessing function 608, and the overview graphic 1332 displays a operational status of GREEN, a run time of 98.75 MIN, a fluid flow rate of 2.5 g/s, and a fault indicator of NONE that may be associated with more than one data source parameter within theprocessing function 608. - In this example, the text data within the overview graphic 1332 contains more than one data source field. The
auto path generator 514 ofFIG. 5 links paths from parameters within theinput function 612, theprocessing function 608, and theoutput function 614 to the corresponding data source fields within the overview graphic 1332. Also, in this example, the data source fields associated with the overview graphic 1332 and the pump graphic 1328 are matched automatically by theauto path generator 514 to the process control algorithm information within the processcontrol algorithm image 604. If there is more than one process control algorithm information match for the overview graphic 1332 or the pump graphic 1328, the processgraphic editor 504 may prompt a system designer to specify which parameter to link to which graphic. -
FIG. 17 illustrates the processcontrol algorithm image 604 and the process controlgraphic image 606 ofFIG. 12 , which contains a graphical userinterface prompt list 1720 similar to the graphical userinterface prompt list 1320 ofFIG. 13 . The example graphical userinterface prompt list 1720 includes graphics 1724-1729. The graphics 1724-1729 displayed in the graphical userinterface prompt list 1720 are transmitted from thegraphics list filter 510 ofFIG. 5 based on the function and/or parameters dragged-and-dropped into thegraphic image area 616 ofFIG. 12 . - In the example of
FIG. 17 , the process control algorithm including theinput function 612, theprocessing function 608, theoutput function 614, and theoutput parameter 610 ofFIG. 12 , have been selected and dropped into thegraphic image area 616 ofFIG. 12 . Thegraphics list filter 510 ofFIG. 5 determines the information contained within theinput function 612, theprocessing function 608, theoutput function 614, and theoutput parameter 610 and filters graphics included in thegraphics cache 512 that match or correspond to the dragged-and-dropped process control algorithm information. The matching or corresponding graphics 1724-1729 are displayed in the graphical userinterface prompt list 1720. In this example, the RATE HIST graphic 1729 is selected. The RATE HIST graphic 1729 may display pump fluid flow rate values over a specified time. The selected graphic 1729 has not yet been linked to the process control algorithm information. -
FIG. 18 illustrates thedisplay 602 containing the processcontrol algorithm image 604 and the process controlgraphic image 606 ofFIG. 12 , which contains the visual graphical representation of the selected graphic 1729. The graphic 1729 may display the fluid flow rate over a specified time through, for example, the pump. The data source field associated with the chart graphic 1729 is automatically linked by theauto path generator 514 to one or more parameters and/or parameter(s) within one or more function(s) within the process control algorithm contained in the processcontrol algorithm image 604. The process control algorithm may include a function and/or parameter within theprocessing function 608 that tracks the fluid flow rate over time. The fluid flow rate data may be stored in the process controlsource address cache 506 ofFIG. 5 . -
FIG. 19 illustrates an exampleprocess control environment 1900 including thedisplay 602 containing a processcontrol explorer image 1904 and the process controlgraphic image 606 ofFIG. 6 . The processcontrol explorer image 1904, named OBJECT EXPLORER, may be a graphical user interface, application window, etc. The processcontrol explorer image 1904 displaysprocess control hardware 1910 organized in a hierarchical structure. The processcontrol explorer image 1904 enables a system designer to organize and/or browse hardware within a process control system. Theprocess control hardware 1910 may include one or more process control systems, workstations, controllers, data cards, equipment, field devices, etc. Theprocess control hardware 1910 may be dragged-and-dropped onto the graphic 617 in the same manner as process control algorithm information. In this example, aprocess control SYSTEM 01 includesWORKSTATION 01,WORKSTATION 02, a CONTROLLERS folder, and a DEVICES folder. The CONTROLLERS folder includesCONTROLLER 03,CONTROLLER 07, and data card CARD SIP01. The DEVICES folder includes process control equipment including a VALVE V102, a TANK T455, and aPUMP P321 1912. In addition, the DEVICES folder includes a PRESS. TRANSMITTER PT101. ThePUMP P321 1912 may correspond to thepump 112 ofFIG. 1 , theCONTROLLER 03 may correspond to thecontroller 106, theWORKSTATION 01 may correspond to theworkstation 102, and the PRESS. TRANSMITTER PT101 may correspond to thefield device 110a. A system designer may click into and/or open any of hardware to view and/or edit configuration information, data source information, address information, setup information, etc. - The example process control
graphic image 606 within thedisplay 602 includes thegraphic image area 616 containing the graphic 617 ofFIG. 6 , which includes thetext data representation 618 and thegraphical data representation 620. The graphic 617 may be loaded from thegraphics cache 512 ofFIG. 5 or created manually. In the example, the graphic 617 has not yet been linked to a data source. As a result, thetext data representation 618 and thegraphical data representation 620 are displayed with null data values. - In the example of
FIG. 19 , thePUMP P321 1912 is selected. The graphic 617 is linked to a data value by selecting thePUMP P321 1912, and dragging thePUMP P321 1912 to and dropping it on the graphic 617. In another example, hardware with multiple parameters such as, theCONTROLLER 03, may be dragged-and-dropped onto the graphic 617. In this case, the processgraphic editor 504 ofFIG. 5 may prompt a system designer to specify which parameter within theCONTROLLER 03 to link to the graphic 617. - In another implementation the graphic
imagine area 616 may not contain a graphic. Theprocess control hardware 1910 may be dragged-and-dropped to the graphicimagine area 616 similar to the example ofFIG. 8 . The processgraphic editor 504 may prompt a system designer with a list of graphics corresponding to the dragged-and-droppedprocess control hardware 1910. Thegraphics list filter 510 may filter the list using parameters within theprocess control hardware 1910, and/or identification information associated with theprocess control hardware 1910. -
FIG. 20 illustrates thePUMP P321 1912 with the processcontrol explorer image 1904 ofFIG. 19 linked to the process controlgraphic image 606. The process controlgraphic image 606 depicts the process controlgraphic image 606 ofFIG. 6 withPUMP P321 1912 as automatically linked to a data source field associated with the graphic 617. The automatic linking, which was initiated by selecting-and-draggingPUMP P321 1912 to the graphic 617, is performed by theauto path generator 514 ofFIG. 5 . As a result of the automatic linking, the data source fields within the graphic 617 contain the path associated with thePUMP P321 1912. Thus, during runtime, the graphic 617 stores the data value associated with thisPUMP P321 1912 path into thedata value field 310 associated with the graphic 617. Additionally, thetext data representation 618 now displays a text value associated with the value within the data value field associated with the graphic 617. Similarly, thegraphical data representation 620 now displays a portion of the bar filled to visually depicting the value associated with the value within the data value field associated with the graphic 617. In this manner, the graphic 617 ofFIG. 20 shows, for example, the fluid flow rate of thepump 112 associated with thePUMP P321 1912 ofFIG. 19 . -
FIG. 21 illustrates a process controlgraphic image 2104 which contains graphics 2110-2120 and a processcontrol algorithm image 2106, which does not contain a process control algorithm. The graphics 2110-2120 within the process controlgraphic image 2104 are already linked to process control algorithm information within the process controlsource address cache 506 ofFIG. 5 . Additionally, the processcontrol algorithm image 2106 does not contain a process control algorithm. In this example, a system designer may have created the process control graphics 2110-2120 within the process controlgraphic image 2104 and linked the process control algorithm information within the process controlsource address cache 506 to data source fields within the process control graphics 2110-2120. The system designer may drag-and-drop the process control graphics 2110-2120 into the processcontrol algorithm image 2106 to create a process control algorithm and automatically link the process control algorithm and the process control graphic. - The process control
graphic image 2104 includes a process control graphic containing atank 2110, a tank-pump pipe 2112, apump 2114, a pump-mixer pipe 2116, a mixer 2128, and anoutflow pipe 2120. The process control graphics 2110-2120 may be included in a graphical interface for a system operator providing process information on the tank-pump-mixer system. The information may include text and/or graphics displaying the fluid flow rate, pipe status, mixer speed, etc. in association with thetank 2110, the tank-pump pipe 2112, thepump 2114, the pump-mixer pipe 2116, themixer 2118, and/or theoutflow pipe 2120. Although the controlalgorithm information image 2104 is described as having one of each graphic described below, the process controlalgorithm information image 2104 may include two or more of any graphic or additional graphics. - The example process
control algorithm image 2106 within thedisplay 602 includes thefunction image area 2130. However, thefunction image area 2130 does not yet contain functions and/or parameters. Functions and/or parameters may be automatically created within thefunction image area 2130 by selecting thegraphics graphic image 2104, and dragging and dropping the selected graphics onto thefunction image area 2130 of the process controlgraphic image 2106. Each selection may be dragged-and-dropped individually or as a group. In the same manner as theauto path generator 514 ofFIG. 5 automatically links graphics to process control algorithm information, theauto path generator 514 may automatically link parameters and/or parameters within one or more functions to process control algorithm information within the data source fields of graphics. -
FIG. 22 illustrates the process controlgraphic image 2104 and the processcontrol algorithm image 2106 ofFIG. 21 , which now contains a graphicaluser interface list 2220. The example graphicaluser interface list 2220 is similar to the example graphical userinterface prompt list 1320 ofFIG 13 . The graphicaluser interface list 2220 includes afunction list box 2222, and functions 2224-2228. The functions 2224-2228 displayed in thefunction list box 2222 may be transmitted from a function list filter similar to thegraphics list filter 510 ofFIG. 5 and correspond to the graphics dragged-and-dropped onto thefunction image area 2130. - In the example of
FIG. 22 , the process control algorithm including thetank 2110, the tank-pump pipe 2112, thepump 2114, the pump-mixer pipe 2116, the mixer 2128, and theoutflow pipe 2120 ofFIG. 21 , are selected and dropped on to thegraphic image area 2130. The function list filter determines the type of information contained within thetank 2110, the tank-pump pipe 2112, thepump 2114, the pump-mixer pipe 2116, the mixer 2128, and/or theoutflow pipe 2120 and filters functions stored in a function cache with fields that match or correspond to fields and/or information within properties of the dragged-and-dropped graphics 2110-2120. The matching or corresponding algorithms and/or the functions 2224-2228 are displayed in the graphicaluser interface list 2220. The algorithms and/or the functions 2224-2228 may be displayed as text, visual graphical representations, or any other possible representation of the algorithms and/or functions 2224-2228. In this example, theCTRL LOOP algorithm 2227 is selected. In other example implementations, multiple and/or different functions may be selected. -
FIG. 23 illustrates thedisplay 602 containing the process controlgraphic image 2104 and the processcontrol algorithm image 2106 ofFIG. 21 , which now contains a process control algorithm. The processcontrol algorithm image 2106 corresponds to theCTRL LOOP algorithm 2227 selected from thefunction list 2220. TheCTRL LOOP 2227 algorithm includes aninput function 2322, aprocessing function 2320, anoutput function 2324 and aparameter 2328 associated with an output of theprocessing function 2320. The processcontrol CTRL LOOP 2227 algorithm has been automatically linked to process control algorithm information with the graphics 2110-2120 of the process controlgraphic image 2104. In this example, theinput function 2322, theprocessing function 2320, theoutput function 2324 and theparameter 2328 are loaded from the function cache. The data source fields within parameters associated with theinput function 2322, theprocessing function 2320, the output function 2325 and theparameter 2328 are automatically linked to the process controlsource address cache 506 by theauto path generator 514 ofFIG. 5 . -
FIGS. 24A-24D and25 are flowcharts representative of example methods of processes that may be performed to create and automatically link process control graphics to process control algorithm information. The example methods may be implemented using machine readable instructions, code, software, etc. that is executed using, for example, a processor system such as thesystem 2600 ofFIG. 26 . However, the one or more of the blocks depicted in the flowcharts may be implemented in any other manner, including dedicated purpose circuitry, manual operations, etc. Additionally, although the example methods are described with reference to the flowcharts ofFIGS. 24A-24D and25 , other methods of creating process control graphics based on process control algorithm information may additionally or alternatively be used. For example, the order of execution of the blocks depicted in the flowcharts ofFIGS. 24A-24D and25 may be changed, and/or some of the blocks described may be rearranged, eliminated, or combined. - In particular,
example methods FIGS. 24A-24D may be performed to implement the example processgraphic editor 504 ofFIG. 5 , the processcontrol algorithm compiler 502 and/or theauto path generator 514. Theexample methods methods graphic editor 504, processcontrol algorithm compiler 502 and/or theauto path generator 514, at predetermined intervals, such as hourly, daily, etc. Additionally or alternatively, theexample methods graphic editor 504 when process control algorithm information is dragged-and-dropped from the processcontrol algorithm compiler 502. - The
method 2400 begins atblock 2402 where process control algorithm information is selected within a process control algorithm image. Inblock 2404, the selected process control algorithm information is then dragged and dropped onto a process control graphic image. In addition to a drag-and-drop action, other example actions may include a select-and-paste, a copy-and-paste, a lasso-and-drop, highlight-and-inset, etc. - Control then proceeds to block 2406 where the process
graphic editor 504 ofFIG. 5 compiles the process control algorithm information dropped into the process control graphic image. Inblock 2408, the processgraphic editor 504 determines if the process control algorithm information dropped into the processgraphic editor 504 was dropped specifically onto a graphic within the processgraphic editor 504. If the process control algorithm information was dropped onto a graphic, control proceeds to block 2412, otherwise control proceeds to block 2452, where inFIG. 24C amethod 2450 is performed to display a filtered list of graphics. - In
block 2412 ofFIG. 24A , the processgraphic editor 504 ofFIG. 5 determines if the dragged-and-dropped process control algorithm information includes one or more parameters. If the process control algorithm information includes one or more parameters,block 2416 is executed. If the process control algorithm information contains at least one function, control proceeds to block 2432 ofFIG. 24B . Inblock 2416 the processgraphic editor 504 determines if there is more than one combination the dragged-and-dropped parameter(s) with the graphic(s). If there is at most one combination,block 2422 is executed. If there is more than one parameter-graphic combination,block 2418 is executed, at which the processgraphic editor 504 queues the parameters and displays a list of graphics within the processgraphic editor 504 that can be linked to the parameter. In this example implementation, the processgraphic editor 504 displays a list of all remaining graphics within the processgraphic editor 504 that have data source fields that may be linked to one or more parameters. In another possible implementation, the processgraphic editor 504 filters the list of graphics within the processgraphic editor 504 based on the type of parameter. In the case a parameter contains more than one data source field, the processgraphic editor 504 may display a list of the data source fields within the parameter for a system designer to select which field(s) to link. - Next, in
block 2420, a graphic from the list is selected and control proceeds to block 2422 where the processgraphic editor 504 determines if the data source associated with the parameter matches or corresponds to the data source type of the data source field associated with the graphic. For example, if a parameter contains the status of a pump, as OFF, ON, or percent ON, and the data type field associated with the graphic is configured to contain a decimal value, the processgraphic editor 504 may detect this mismatch in data types and send an error message (block 2424). If the data source type of the parameter matches the data type field and any other information associated with the graphic, control proceeds to block 2426. Inblock 2426, theauto path generator 514 automatically links the data source field associated with the graphic with data within the parameter. Then, inblock 2428, the graphic displays the linked algorithm information contained in the data source field. The graphic display could be, for example, text, numerical values, graphical information, etc. Next inblock 2430, the processgraphic editor 504 checks for any remaining parameters that have been dragged-and dropped to the process control graphic image, but which have not yet been linked to a graphic. In the case where a parameter is processed throughblock 2422 and the processgraphic editor 504 determines there is a data source mismatch, the parameter may be considered processed and may not be considered as an un-linked parameter inblock 2430. If there are remaining unprocessed parameters, control loops back to block 2418 where the list of reaming graphics is displayed for the next parameter. If there is not at least one parameter remaining in queue, themethod 2400 ends. - In
block 2432 ofFIG. 24B , themethod 2431 associated with the processgraphic editor 504 displays the list of graphics within the process control graphic image that match or correspond to the parameter(s) within the one or more functions. Then, inblock 2434 the graphic(s) are selected that are to be linked to the dragged-and dropped process control algorithm parameter(s) within the one or more functions. In an example, a function and parameter may be dragged-and-dropped onto multiple graphics within the process control graphic image. Decision block 2414 was executed because the process control algorithm information included at least one function. In this case, the processgraphic editor 504 processes the function and parameter within the correspondingmethod 2431. The processgraphic editor 504 queues any parameters to be processed with the parameter(s) within one or more functions. - Control proceeds to block 2436, at which the process
graphic editor 504 determines if the data source associated with the function(s) matches the data type field or any additional information associated with the selected graphic(s). If the processgraphic editor 504 detects a mismatch in data types an error message is sent (block 2438). If the data source type of the parameter(s) within one or more functions matches the data source property associated with the graphic(s), control proceeds to block 2440. Inblock 2440, theauto path generator 514 automatically links the data source property associated with the graphic(s) to the data source within the function(s). - Then in
block 2442, the selected graphic(s) displays the linked algorithm information contained in the data source property field. The graphic display could be, for example, text, numerical values, graphical information, etc. Next, inblock 2444, the processgraphic editor 504 checks for any remaining functions and/or parameters that have been dragged-and dropped to the process control graphic image, but which have not yet been linked to a graphic. In the case where a function and/or parameter(s) within one or more functions is processed throughblock 2436 and the processgraphic editor 504 determines there is a data source mismatch, the function may be considered processed and may not be considered as an un-linked parameter inblock 2446. If there are remaining unprocessed functions and/or parameters, control loops back to block 2432 where the list of reaming graphics is displayed for the next function and/or parameter. If all of the parameters dragged to the process control graphic image are processed, themethod 2431 ends. - In
block 2452 ofFIG. 24C , themethod 2450 associated with the processgraphic editor 504 determines if the process control algorithm information dragged-and-dropped to the processgraphic editor 504 contains at least one function. If the process control algorithm information includes at least one function, control proceeds to block 2480 ofFIG. 24D to create and automatically link at least one graphic to the process control algorithm information including the parameter(s) within the one or more functions. If the process control algorithm information does not contain at least one function control proceeds to block 2456. Inblock 2456 the processgraphic editor 504 queues the dragged-and-dropped parameter(s) and processes the next one in line. Then, inblock 2458, the processgraphic editor 504 relays the parameter info to thegraphics list filter 510, where thegraphics list filter 510 accesses thegraphics cache 512 and selects the graphics that match the data source properties of the parameter. Control then proceeds to block 2462 where the processgraphic editor 504 processes the list of graphics returned from thegraphics list filter 510. If there is not at least one graphic on the list,block 2464 is executed where an error message is sent. - If there is at least one matching graphic in the filtered list, control proceeds to block 2466 where the process
graphic editor 504 displays the filtered list of graphics. Then, inblock 2468, one or more of the graphics are selected. Next, inblock 2470, the selected graphics are queued and the data source field associated with the next graphic in line is automatically linked to the parameter by theauto path generator 514. Then, inblock 2472, the graphic displays the data contained in its associated data source field. Next, inblock 2474, theauto path generator 514 checks if there are remaining graphics in queue. If there is at least one graphic, control loops back to block 2470 and the next graphic in line is automatically linked to the parameter. If there is not at least one graphic in queue, control proceeds to block 2476 where the processgraphic editor 504 checks if there is at least one parameter in queue. In the case where a parameter is processed throughblock 2462 and the processgraphic editor 504 determines there is not at least one graphic configured for the parameter, the parameter may be considered processed and may not be considered as an un-linked parameter inblock 2476. If there is at least one parameter, control loops back to block 2456 and the next parameter is processed. If there is not at least one parameter remaining in queue, themethod 2450 ends. - In
block 2480 ofFIG. 24D , themethod 2479 associated with the processgraphic editor 504 queues the dragged-and-dropped process control algorithm information and processes the next function in line (block 2480). Then, inblock 2482, the processgraphic editor 504 relays the function and/or parameter(s) within the function onto thegraphics list filter 510, where thegraphics list filter 510 accesses thegraphics cache 512 and selects the graphics that match the data type field and any additional information with the parameter(s) within the function. Control then proceeds to block 2484 where the processgraphic editor 504 processes the list of graphics returned from thegraphics list filter 510. If there is not at least one graphic on the list,block 2464 is executed where an error message is sent. - If there is at least one graphic in the filtered list, control proceeds to block 2486 where the process
graphic editor 504 displays the filtered list of graphics. Then, inblock 2488, one or more of the graphics are selected. Next, inblock 2490, the selected graphics are queued and the data source field associated with the next graphic in line is automatically linked to the parameter(s) within the function by theauto path generator 514. Then, inblock 2492, the graphic displays the data contained in its associated data source field. Next, inblock 2494, theauto path generator 514 checks if there are remaining graphics in queue. If there is at least one graphic, control loops back to block 2490 and the next graphic in line is automatically linked to the parameter(s) within the function. If there is not at least one graphic in queue, control proceeds to block 2496 where the processgraphic editor 504 checks if there is at least one function in queue. In the case where a function is processed throughblock 2484 and the processgraphic editor 504 determines there is not at least one graphic configured for the function, the function may be considered processed and may not be considered as an un-linked function inblock 2496. If there is at least one function, control loops back to block 2480 and the next function is processed. If there is not at least one function remaining in queue, themethod 2479 ends. In the case in which parameters within more than one function are to be linked to one graphic, theexample method 2479 may prompt a system designer with a list of at least some of the parameters within the more than one function dragged-and-dropped on the process control graphic image, enabling the system designer to select the parameters to link to the graphic. - An
example method 2500 that may be performed to implement the example theauto path generator 514 ofFIG. 5 is shown inFIG. 25 . Theexample method 2500 may be executed at predetermined intervals, based on an occurrence of a predetermined event, etc., or any combination thereof. For example, themethod 2500 may be executed in a design environment upon start-up of theauto path generator 514, at predetermined intervals, such as hourly, daily, etc. Additionally or alternatively, theexample method 2500 may be executed upon the occurrence of a trigger generated remotely, for example, at the processgraphic editor 504 when process control algorithm information is dragged-and-dropped from the processcontrol algorithm compiler 502. - The
method 2500 begins atblock 2502 where theauto path generator 514 receives notification from the processgraphic editor 504 of a graphic to be linked to process control algorithm information. The notification may contain an identifier and/or the data source field of the graphic. Additionally, the notification may contain the process control algorithm information to be linked to the graphic. This may contain a function identifier, a parameter identifier, and/or parameter(s) within one or more functions identifiers. Then, inblock 2504, theauto path generator 514 searches for the process control algorithm information associated with the function and/or parameter identifiers. Once the process control algorithm information is found, theauto path generator 514 copies the path associated with the data source within the process control algorithm information (block 2506). Then, inblock 2508, the copied path is inserted in the data source field associated with the graphic. Control then proceeds to block 2510 where the graphic accesses the data source path back to the process control algorithm information within the corresponding function and/or parameter. Then, inblock 2512, the graphic loads the data source within the parameter, and/or parameter(s) within the one or more functions ending theauto link method 2500. -
FIG. 26 is a block diagram of anexample processor system 2600 that may be used to implement the apparatus and methods described herein. As shown inFIG. 26 , theprocessor system 2600 includes aprocessor 2612 that is coupled to aninterconnection bus 2614. Theprocessor 2612 includes a register set or register space 2616, which is depicted inFIG. 26 as being entirely on-chip, but which could alternatively be located entirely or partially off-chip and directly coupled to theprocessor 2612 via dedicated electrical connections and/or via theinterconnection bus 2614. Theprocessor 2612 may be any suitable processor, processing unit or microprocessor. Although not shown inFIG. 26 , thesystem 2600 may be a multiprocessor system and, thus, may include one or more additional processors that are identical or similar to theprocessor 2612 and that are communicatively coupled to theinterconnection bus 2614. - The
processor 2612 ofFIG. 26 is coupled to achipset 2618, which includes amemory controller 2620 and a peripheral input/output (I/O)controller 2622. As is well known, a chipset typically provides I/O and memory management functions as well as a plurality of general purpose and/or special purpose registers, timers, etc. that are accessible or used by one or more processors coupled to thechipset 2618. Thememory controller 2620 performs functions that enable the processor 2612 (or processors if there are multiple processors) to access asystem memory 2624 and amass storage memory 2625. - The
system memory 2624 may include any desired type of volatile and/or non-volatile memory such as, for example, static random access memory (SRAM), dynamic random access memory (DRAM), flash memory, read-only memory (ROM), etc. Themass storage memory 2625 may include any desired type of mass storage device including hard disk drives, optical drives, tape storage devices, etc. - The peripheral I/
O controller 2622 performs functions that enable theprocessor 2612 to communicate with peripheral input/output (I/O)devices network interface 2630 via a peripheral I/O bus 2632. The I/O devices network interface 2630 may be, for example, an Ethernet device, an asynchronous transfer mode (ATM) device, an 802.11 device, a DSL modem, a cable modem, a cellular modem, etc. that enables theprocessor system 2600 to communicate with another processor system. - While the
memory controller 2620 and the I/O controller 2622 are depicted inFIG. 26 as separate functional blocks within thechipset 2618, the functions performed by these blocks may be integrated within a single semiconductor circuit or may be implemented using two or more separate integrated circuits. - Although certain methods, apparatus, and articles of manufacture have been described herein, the scope of coverage of this patent is not limited thereto. To the contrary, this patent covers all methods, apparatus, and articles of manufacture fairly falling within the scope of the appended claims either literally or under the doctrine of equivalents.
Claims (21)
- A method of automatically linking process control graphics to process control algorithm information, the method comprising:- displaying a first process control image (604) including process control algorithm information;- displaying adjacent to the first process control image (604) a second process control image (606) corresponding to a process control graphic including a set of graphic properties; characterized by:- receiving an indication of a user-initiated drag operation and an indication of a user-initiated drop operation of∘ at least a portion of the process control algorithm information to the process control graphic;- upon receiving the indication of the user-initiated drop operation, automatically linking, by an auto path generator, the at least the portion of the process control algorithm information included in the first process control image to the graphic property corresponding to the second process control image so that a run-time display of information corresponding to the at least the portion of the process control algorithm information included in the first process control image includes the graphic property corresponding to the second process control image, wherein automatically linking, by the auto path generator, the at least the portion of the process control algorithm information to the graphic property includes:∘ determining a path associated with a data source corresponding to the at least the portion of the process control algorithm information included in the first process control image;∘ inserting the path into a data source field corresponding to the graphic property corresponding to the second process control image;∘ accessing, by the process control graphic, the data source via the path; and∘ loading, by the process control graphic during run-time, a value of the data source.
- A method as defined in claim 1, further comprising automatically linking a plurality of paths for the at least the portion of the process control algorithm information to one or more graphic properties.
- A method as defined in claim 1, wherein the indication of the user-initiated drag operation further includes an indication of one of copying, highlighting, lassoing, or boxing with a cursor the at least the portion of the process control algorithm information displayed on the first process control image or the graphic property of the set of graphic properties of the second process control image.
- A method as defined in claim 1, wherein the indication of the user-initiated drop operation further includes an indication of one of pasting, inserting, or moving the at least the portion of the process control algorithm information displayed on the first process control image or the graphic property of the set of graphic properties of the second process control image.
- A method as defined in claim 1, wherein the at least the portion of the process control algorithm information includes multiple parameters.
- A method as defined in claim 1, wherein the at least the portion of the process control algorithm information included in the first process control image comprises at least one process control function containing at least one process control parameter.
- A method as defined in claim 6, wherein each of a plurality of process control parameters is individually selectable.
- A method as defined in claim 1, wherein the process control algorithm information comprises one or more process control parameters.
- A method as defined in claim 8 wherein receiving the user-initiated drop operation of the at least a portion of the process control algorithm comprises receiving an indication of multiple process control parameters.
- A method as defined in claim 8, further comprising automatically linking one of the one or more process control parameters to the graphic property corresponding to the second process control image.
- A method as defined in claim 1,
wherein receiving the indication of the user-initiated drag operation comprises receiving an indication of a dragging of the at least the portion of the process control information included in the first process control image to an area of the second process control image without any process control graphics, and
wherein the method further comprises prompting a user with a list of one or more process control graphics having graphic properties corresponding to the at least the portion of the process control algorithm information included in the first process control image, and automatically linking a path for the at least the portion of the process control algorithm information to at least one process control graphic from the list in response to a user selection. - A method as defined in claim 11, further comprising displaying the list prior to automatically linking the at least the portion of the process control algorithm information included in the first process control image to the at least one process control graphic from the list.
- A method as defined in claim 11, further comprising filtering the list based on the at least the portion of the process control algorithm information included in the first process control image dragged to the area of the second process control image without the any process control graphic.
- A method as defined in claim 1, further comprising:displaying a third process control image including process control hardware information; andautomatically linking at least a portion of the process control hardware information to the graphic property in the second process control image in response to an indication of a user selection and a user-initiated drag operation associated with the third and second process control images.
- A method as defined in claim 1, further comprising:receiving an indication of a user-initiated drag operation and a user-initiated drop operation of at least one process control graphic property corresponding to the second process control image to the first process control image,prompting a user with a list of at least one process control function of the process control algorithm information included in the first process control image, andin response to a user selection from the list, creating a process control function corresponding to the user selection, and automatically linking a path from the at least one process control graphic property to the created process control function corresponding to the user selection.
- A system to automatically link process control graphics to process control algorithm information, the system comprising:- a display (602) containing a first process control image (604) including process control algorithm information;- the display (602) containing a second process control image (606) adjacent to the first process control image (604) and corresponding to one or more process control graphics;- a path link from at least a portion of the process control algorithm information to a graphic property of a set of properties corresponding to the one or more process control graphics indicated by the second process control image so that a run-time image of the at least the portion of the process control algorithm information includes the graphic property via the path link; and characterized by:- an auto path generator that creates the path link upon receiving an indication of a user-initiated dragging and an indication of a user-initiated dropping of∘ the at least the portion of the process control algorithm information to the process control graphic of,- wherein the creation of the path link by the auto path generator includes:whereby the one or more process control graphics access the data source via the path and load, during run-time, a value of the data source.∘ a determination of a path associated with a data source corresponding to the at least the portion of the process control algorithm information included in the first process control image; and∘ an insertion of the path into a data source field corresponding to the graphic property corresponding to the second process control image,
- The method of claim 1, wherein receiving the indication of the user-initiated drag operation comprises receiving an indication of the at least the portion of the process control algorithm information displayed on the first process control image.
- The method of claim 1, further comprising dynamically changing the graphic property of the run-time display based on a change in the at least the portion of the process control algorithm information included in the first process control image.
- The system of claim 16, wherein the graphic property included in the run-time image of the at least the portion of the process control algorithm information included in the first process control image dynamically changes based on changes to values of the at least the portion of the process control algorithm information included in the first process control image.
- The system of claim 16, further comprising a property definition interface corresponding to the graphic property of a particular process control graphic and displaying one or more data source fields corresponding to the graphic property of the particular process control graphic via the property definition interface.
- The system of claim 20, further comprising a plurality of property definition interfaces corresponding to a plurality of graphic properties of the particular process control graphic.
Applications Claiming Priority (1)
| Application Number | Priority Date | Filing Date | Title |
|---|---|---|---|
| US12/055,896 US9043716B2 (en) | 2008-03-26 | 2008-03-26 | Methods and apparatus to create process control graphics based on process control information |
Publications (3)
| Publication Number | Publication Date |
|---|---|
| EP2146259A2 EP2146259A2 (en) | 2010-01-20 |
| EP2146259A3 EP2146259A3 (en) | 2010-01-27 |
| EP2146259B1 true EP2146259B1 (en) | 2017-05-17 |
Family
ID=40637358
Family Applications (1)
| Application Number | Title | Priority Date | Filing Date |
|---|---|---|---|
| EP09155953.4A Active EP2146259B1 (en) | 2008-03-26 | 2009-03-24 | Method and apparatus to create process control graphics based on process control algorithm information |
Country Status (5)
| Country | Link |
|---|---|
| US (1) | US9043716B2 (en) |
| EP (1) | EP2146259B1 (en) |
| JP (2) | JP5584424B2 (en) |
| CN (1) | CN101551667B (en) |
| GB (1) | GB2458561B (en) |
Cited By (1)
| Publication number | Priority date | Publication date | Assignee | Title |
|---|---|---|---|---|
| EP3640794A4 (en) * | 2017-05-31 | 2021-02-24 | Omron Corporation | Program development support device, program development support method, and program development support program |
Families Citing this family (42)
| Publication number | Priority date | Publication date | Assignee | Title |
|---|---|---|---|---|
| WO2010065678A1 (en) * | 2008-12-02 | 2010-06-10 | Innovations Holdings, L.L.C. | Method and apparatus for configurable systems |
| US9417626B2 (en) | 2008-09-29 | 2016-08-16 | Fisher-Rosemount Systems, Inc. | Efficient design and configuration of elements in a process control system |
| US8881039B2 (en) | 2009-03-13 | 2014-11-04 | Fisher-Rosemount Systems, Inc. | Scaling composite shapes for a graphical human-machine interface |
| US8825183B2 (en) | 2010-03-22 | 2014-09-02 | Fisher-Rosemount Systems, Inc. | Methods for a data driven interface based on relationships between process control tags |
| US9071484B1 (en) * | 2011-04-05 | 2015-06-30 | Elemental Technologies, Inc. | Feedback optimized video coding parameters |
| WO2013110166A1 (en) * | 2012-01-26 | 2013-08-01 | S. A. Armstrong Limited | Method and system for selecting a device from a graphical interface |
| USD734348S1 (en) * | 2012-11-07 | 2015-07-14 | Bionime Corporation | Display screen for blood glucose meter with graphical user interface |
| US10282676B2 (en) | 2014-10-06 | 2019-05-07 | Fisher-Rosemount Systems, Inc. | Automatic signal processing-based learning in a process plant |
| US10386827B2 (en) | 2013-03-04 | 2019-08-20 | Fisher-Rosemount Systems, Inc. | Distributed industrial performance monitoring and analytics platform |
| US10223327B2 (en) * | 2013-03-14 | 2019-03-05 | Fisher-Rosemount Systems, Inc. | Collecting and delivering data to a big data machine in a process control system |
| US9558220B2 (en) | 2013-03-04 | 2017-01-31 | Fisher-Rosemount Systems, Inc. | Big data in process control systems |
| US10909137B2 (en) | 2014-10-06 | 2021-02-02 | Fisher-Rosemount Systems, Inc. | Streaming data for analytics in process control systems |
| US10678225B2 (en) | 2013-03-04 | 2020-06-09 | Fisher-Rosemount Systems, Inc. | Data analytic services for distributed industrial performance monitoring |
| US10866952B2 (en) | 2013-03-04 | 2020-12-15 | Fisher-Rosemount Systems, Inc. | Source-independent queries in distributed industrial system |
| US9397836B2 (en) | 2014-08-11 | 2016-07-19 | Fisher-Rosemount Systems, Inc. | Securing devices to process control systems |
| US9665088B2 (en) | 2014-01-31 | 2017-05-30 | Fisher-Rosemount Systems, Inc. | Managing big data in process control systems |
| US9823626B2 (en) | 2014-10-06 | 2017-11-21 | Fisher-Rosemount Systems, Inc. | Regional big data in process control systems |
| US10649449B2 (en) | 2013-03-04 | 2020-05-12 | Fisher-Rosemount Systems, Inc. | Distributed industrial performance monitoring and analytics |
| US10649424B2 (en) | 2013-03-04 | 2020-05-12 | Fisher-Rosemount Systems, Inc. | Distributed industrial performance monitoring and analytics |
| US10120350B2 (en) * | 2013-03-11 | 2018-11-06 | Fisher-Rosemount Systems, Inc. | Background collection of diagnostic data from field instrumentation devices |
| US11573672B2 (en) | 2013-03-15 | 2023-02-07 | Fisher-Rosemount Systems, Inc. | Method for initiating or resuming a mobile control session in a process plant |
| CN105051760B (en) | 2013-03-15 | 2018-03-02 | 费希尔-罗斯蒙特系统公司 | Data modeling operating room |
| GB2522338B (en) | 2014-01-03 | 2020-12-16 | Fisher Rosemount Systems Inc | Reusable graphical elements with quickly editable features for use in user displays of plant monitoring systems |
| USD754676S1 (en) * | 2014-04-04 | 2016-04-26 | Adp, Llc | Display screen or portion thereof with graphical user interface |
| USD754144S1 (en) * | 2014-04-04 | 2016-04-19 | Adp, Llc | Display screen or portion thereof with graphical user interface |
| USD754675S1 (en) * | 2014-04-04 | 2016-04-26 | Adp, Llc | Display screen or portion thereof with graphical user interface |
| USD757038S1 (en) * | 2014-04-18 | 2016-05-24 | Nutonian, Inc. | Display screen with graphical user interface |
| EP2942678B1 (en) * | 2014-05-08 | 2019-07-17 | dSPACE digital signal processing and control engineering GmbH | Allocating revolver |
| US10168691B2 (en) | 2014-10-06 | 2019-01-01 | Fisher-Rosemount Systems, Inc. | Data pipeline for process control system analytics |
| US20160349931A1 (en) * | 2015-05-28 | 2016-12-01 | Rockwell Automation Technologies, Inc. | Responsive user interface for an industrial environment |
| US10505786B2 (en) * | 2015-12-03 | 2019-12-10 | Abb Schweiz Ag | Root cause analysis of failure to meet communication requirements in a process control system |
| US10503483B2 (en) | 2016-02-12 | 2019-12-10 | Fisher-Rosemount Systems, Inc. | Rule builder in a process control network |
| US10347357B2 (en) * | 2017-04-24 | 2019-07-09 | Intel Corporation | Post-packaging environment recovery of graphics on-die memory |
| US10365641B2 (en) | 2017-06-19 | 2019-07-30 | Fisher-Rosemount Systems, Inc. | Synchronization of configuration changes in a process plant |
| EP3441918A1 (en) * | 2017-08-09 | 2019-02-13 | Siemens Aktiengesellschaft | System and method for plant efficiency evaluation |
| US11054974B2 (en) | 2017-10-02 | 2021-07-06 | Fisher-Rosemount Systems, Inc. | Systems and methods for graphical display configuration design verification in a process plant |
| US10788972B2 (en) * | 2017-10-02 | 2020-09-29 | Fisher-Rosemount Systems, Inc. | Systems and methods for automatically populating a display area with historized process parameters |
| DE102018205007A1 (en) * | 2018-04-04 | 2019-10-10 | Volkswagen Aktiengesellschaft | Method, apparatus and computer readable storage medium with instructions for creating a virtual reality application |
| US10649430B2 (en) * | 2018-06-26 | 2020-05-12 | Fisher-Rosemount Systems, Inc. | Method and apparatus for configuring access to multi-variable field devices signals |
| US11126411B2 (en) * | 2018-12-13 | 2021-09-21 | Sap Se | Dashboard user interface for data driven applications |
| US11204690B1 (en) * | 2020-03-05 | 2021-12-21 | Unqork, Inc. | Systems and methods for software development and deployment platforms having advanced workflow and event processing capabilities and graphical version controls |
| US20220382236A1 (en) * | 2021-05-27 | 2022-12-01 | Sap Se | Shared automated execution platform in cloud |
Family Cites Families (26)
| Publication number | Priority date | Publication date | Assignee | Title |
|---|---|---|---|---|
| US5371847A (en) * | 1992-09-22 | 1994-12-06 | Microsoft Corporation | Method and system for specifying the arrangement of windows on a display |
| US5611059A (en) | 1994-09-02 | 1997-03-11 | Square D Company | Prelinked parameter configuration, automatic graphical linking, and distributed database configuration for devices within an automated monitoring/control system |
| EP0876647B1 (en) | 1996-01-25 | 2001-10-31 | Siemens Aktiengesellschaft | Graphic operating surface for programming programmable controllers |
| US5838563A (en) | 1996-04-12 | 1998-11-17 | Fisher-Rosemont Systems, Inc. | System for configuring a process control environment |
| US5918233A (en) * | 1996-05-30 | 1999-06-29 | The Foxboro Company | Methods and systems for providing electronic documentation to users of industrial process control systems |
| US7152116B1 (en) * | 1998-08-24 | 2006-12-19 | National Instruments Corporation | System and method for automatically creating URLs for accessing data sources and data targets |
| JP2001075614A (en) * | 1999-08-31 | 2001-03-23 | Digital Electronics Corp | Editor device and recording medium recording editor program |
| US6854111B1 (en) | 1999-09-24 | 2005-02-08 | Rockwell Software Inc. | Library manager for automated programming of industrial controls |
| US6690981B1 (en) * | 2000-05-04 | 2004-02-10 | National Instruments Corporation | System and method for encapsulating user interface code for a graphical program |
| US6980869B1 (en) | 2000-11-20 | 2005-12-27 | National Instruments Corporation | System and method for user controllable PID autotuning and associated graphical user interface |
| JP2002182739A (en) * | 2000-12-11 | 2002-06-26 | Toshiba Corp | Monitoring controller |
| US6971065B2 (en) * | 2000-12-13 | 2005-11-29 | National Instruments Corporation | Automatically configuring a graphical program to publish or subscribe to data |
| US7287230B2 (en) * | 2000-12-13 | 2007-10-23 | National Instruments Corporation | Configuring a GUI element to subscribe to data |
| US7134085B2 (en) * | 2000-12-13 | 2006-11-07 | National Instruments Corporation | System and method for automatically configuring program data exchange |
| EP1410195A4 (en) * | 2001-06-22 | 2008-03-19 | Wonderware Corp | A customizable system for creating supervisory process control and manufacturing information applications |
| US7367028B2 (en) * | 2001-08-14 | 2008-04-29 | National Instruments Corporation | Graphically deploying programs on devices in a system |
| US7013232B2 (en) * | 2001-08-15 | 2006-03-14 | National Insurance Corporation | Network-based system for configuring a measurement system using configuration information generated based on a user specification |
| US7146231B2 (en) | 2002-10-22 | 2006-12-05 | Fisher-Rosemount Systems, Inc.. | Smart process modules and objects in process plants |
| JP2004005639A (en) * | 2003-05-09 | 2004-01-08 | Hitachi Ltd | Monitoring device |
| US7624375B2 (en) * | 2003-06-12 | 2009-11-24 | National Instruments Corporation | Automatically configuring a graphical user interface element to bind to a graphical program |
| WO2005020003A2 (en) * | 2003-08-13 | 2005-03-03 | National Instruments Corporation | Creating a graphical user interface for selected parameters of a graphical program |
| US7515977B2 (en) | 2004-03-30 | 2009-04-07 | Fisher-Rosemount Systems, Inc. | Integrated configuration system for use in a process plant |
| US7703032B2 (en) * | 2004-04-12 | 2010-04-20 | National Instruments Corporation | Binding a GUI element to live measurement data |
| JP2007536634A (en) * | 2004-05-04 | 2007-12-13 | フィッシャー−ローズマウント・システムズ・インコーポレーテッド | Service-oriented architecture for process control systems |
| WO2005116823A2 (en) | 2004-05-17 | 2005-12-08 | Invensys Systems, Inc. | System and method for developing animated visualization interfaces |
| US20070100872A1 (en) * | 2005-11-03 | 2007-05-03 | Bodin William K | Dynamic creation of user interfaces for data management and data rendering |
-
2008
- 2008-03-26 US US12/055,896 patent/US9043716B2/en not_active Expired - Fee Related
-
2009
- 2009-03-11 JP JP2009057556A patent/JP5584424B2/en active Active
- 2009-03-16 GB GB0904425.6A patent/GB2458561B/en active Active
- 2009-03-24 EP EP09155953.4A patent/EP2146259B1/en active Active
- 2009-03-25 CN CN2009101291126A patent/CN101551667B/en active Active
-
2014
- 2014-07-18 JP JP2014147418A patent/JP5841643B2/en not_active Expired - Fee Related
Cited By (1)
| Publication number | Priority date | Publication date | Assignee | Title |
|---|---|---|---|---|
| EP3640794A4 (en) * | 2017-05-31 | 2021-02-24 | Omron Corporation | Program development support device, program development support method, and program development support program |
Also Published As
| Publication number | Publication date |
|---|---|
| US9043716B2 (en) | 2015-05-26 |
| JP2009238219A (en) | 2009-10-15 |
| JP5584424B2 (en) | 2014-09-03 |
| EP2146259A3 (en) | 2010-01-27 |
| US20090249237A1 (en) | 2009-10-01 |
| JP5841643B2 (en) | 2016-01-13 |
| GB0904425D0 (en) | 2009-04-29 |
| GB2458561B (en) | 2013-02-13 |
| CN101551667A (en) | 2009-10-07 |
| GB2458561A (en) | 2009-09-30 |
| EP2146259A2 (en) | 2010-01-20 |
| CN101551667B (en) | 2013-10-30 |
| JP2014225279A (en) | 2014-12-04 |
Similar Documents
| Publication | Publication Date | Title |
|---|---|---|
| EP2146259B1 (en) | Method and apparatus to create process control graphics based on process control algorithm information | |
| CN109597667B (en) | System and method for configuring and presenting a display navigation hierarchy in a process plant | |
| US11774927B2 (en) | Methods and apparatus to provide a role-based user interface | |
| US9256219B2 (en) | System configuration using templates | |
| JP6190334B2 (en) | Method, product, apparatus, and configuration system for configuring alarm response | |
| JP5173324B2 (en) | Monitoring system and monitoring method | |
| US11054974B2 (en) | Systems and methods for graphical display configuration design verification in a process plant | |
| GB2495024A (en) | Dynamic user interface for configuring and managing a process control system | |
| CN105717810B (en) | Method and apparatus for providing a role-based user interface | |
| GB2512985A (en) | Background collection of diagnostic data from field instrumentation devices | |
| EP3620870B1 (en) | Device and method for embedding a web frame in process graphics | |
| GB2564250A (en) | Interlock chain visualization | |
| GB2568586A (en) | Systems and methods for configuration and presenting a display navigation hierachy in a process plant | |
| GB2568585A (en) | Systems and methods for configuration and presenting a display navigation hierachy in a process plant | |
| GB2568785A (en) | Systems and methods for configuration and presenting a display navigation hierachy in a process plant |
Legal Events
| Date | Code | Title | Description |
|---|---|---|---|
| PUAI | Public reference made under article 153(3) epc to a published international application that has entered the european phase |
Free format text: ORIGINAL CODE: 0009012 |
|
| PUAL | Search report despatched |
Free format text: ORIGINAL CODE: 0009013 |
|
| AK | Designated contracting states |
Kind code of ref document: A2 Designated state(s): AT BE BG CH CY CZ DE DK EE ES FI FR GB GR HR HU IE IS IT LI LT LU LV MC MK MT NL NO PL PT RO SE SI SK TR |
|
| AX | Request for extension of the european patent |
Extension state: AL BA RS |
|
| AK | Designated contracting states |
Kind code of ref document: A3 Designated state(s): AT BE BG CH CY CZ DE DK EE ES FI FR GB GR HR HU IE IS IT LI LT LU LV MC MK MT NL NO PL PT RO SE SI SK TR |
|
| AX | Request for extension of the european patent |
Extension state: AL BA RS |
|
| 17P | Request for examination filed |
Effective date: 20100714 |
|
| 17Q | First examination report despatched |
Effective date: 20100809 |
|
| AKX | Designation fees paid |
Designated state(s): DE GB |
|
| GRAP | Despatch of communication of intention to grant a patent |
Free format text: ORIGINAL CODE: EPIDOSNIGR1 |
|
| INTG | Intention to grant announced |
Effective date: 20161207 |
|
| RBV | Designated contracting states (corrected) |
Designated state(s): DE |
|
| GRAS | Grant fee paid |
Free format text: ORIGINAL CODE: EPIDOSNIGR3 |
|
| GRAA | (expected) grant |
Free format text: ORIGINAL CODE: 0009210 |
|
| AK | Designated contracting states |
Kind code of ref document: B1 Designated state(s): DE |
|
| REG | Reference to a national code |
Ref country code: DE Ref legal event code: R096 Ref document number: 602009046098 Country of ref document: DE |
|
| REG | Reference to a national code |
Ref country code: DE Ref legal event code: R097 Ref document number: 602009046098 Country of ref document: DE |
|
| PLBE | No opposition filed within time limit |
Free format text: ORIGINAL CODE: 0009261 |
|
| STAA | Information on the status of an ep patent application or granted ep patent |
Free format text: STATUS: NO OPPOSITION FILED WITHIN TIME LIMIT |
|
| 26N | No opposition filed |
Effective date: 20180220 |
|
| P01 | Opt-out of the competence of the unified patent court (upc) registered |
Effective date: 20230526 |
|
| PGFP | Annual fee paid to national office [announced via postgrant information from national office to epo] |
Ref country code: DE Payment date: 20240220 Year of fee payment: 16 |